Water Vapour Channel
Description
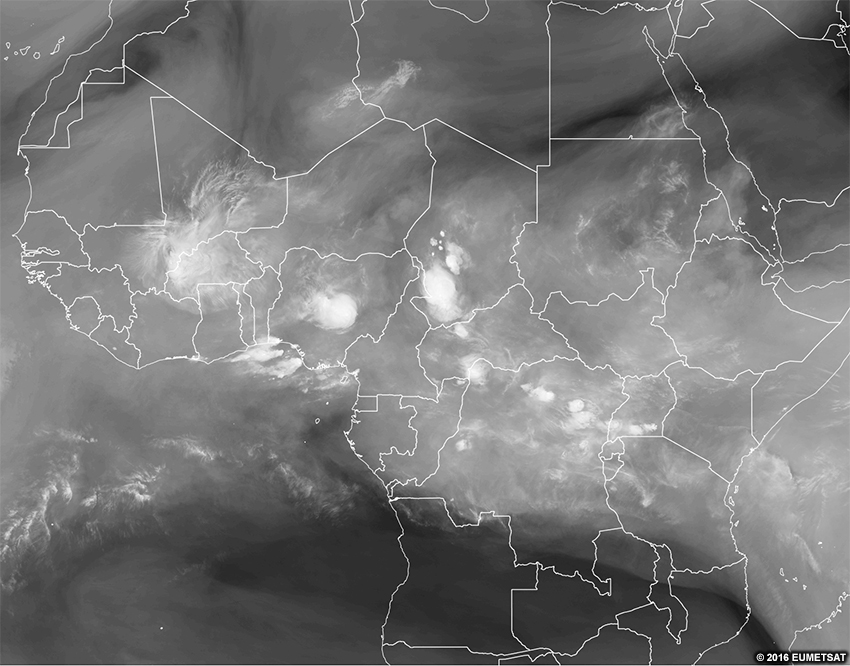
The water vapour (WV) channel measures radiation from a set amount of water vapour in the upper-levels of the troposphere in grey shades. Each pixel shows the same cumulative amount of water vapour detected from the top of the atmosphere downward. The colouration comes from the temperature at which the channel reaches that threshold amount of water vapour radiation as seen in the animation below.
In this animation, the column on the left is longest, with the molecules loosely distributed over a deeper area. The molecules in the other columns are more densely packed and the bases of those columns are higher. The sensor measures the brightness temperature of the water vapour at the bottom of the columns.
Effective Use
The water vapour channel essentially displays the height and distribution of water vapour features. It is particularly well-suited for showing the three-dimensionality of the atmosphere and the continuous layer of water vapour in the mid- and high-latitudes.
The WV channel is less useful for forecasting in the tropics since surface features and small variations drive more of the weather processes. However, WV channel can be good for monitoring developing thunderstorms, mesoscale downdrafts, and upper-level dynamics in the tropics.
WV channels cannot sense land or ocean surfaces since there’s too much water vapour between the sensor and the ground, causing the sensor to always detect a value before reaching the surface.
Severe Convection RGB
Description
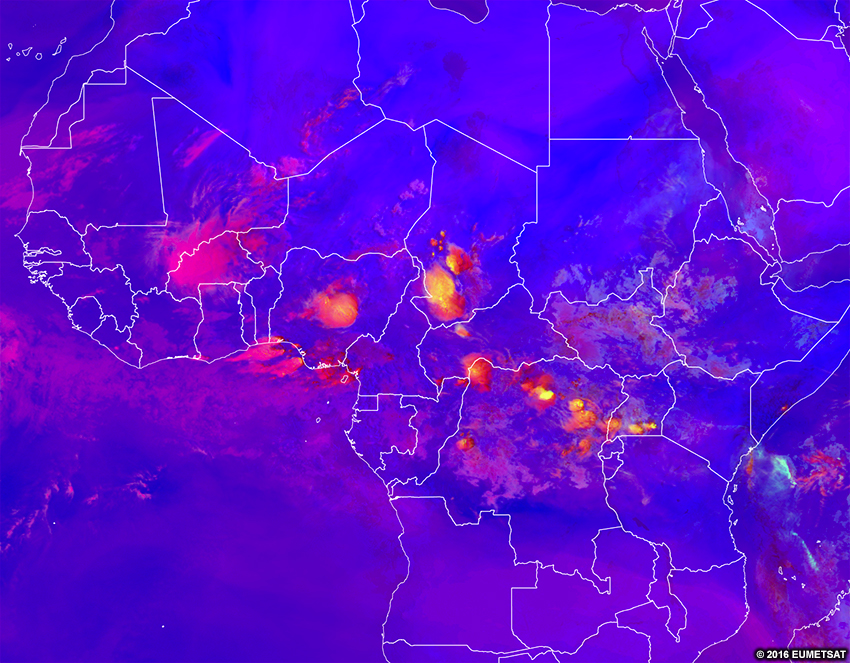
The severe convection RGB shows areas of active thunderstorms with strong updrafts in colours ranging from red (less intense convection) to yellow (most intense convection). The rest of the product is blue or purple to make the strongest storms stand out.
This product is made with a combination of visible, infrared and water vapour channels and channel differences. Because of this, the product can be used only during the day.
Effective Use
Tall, thick clouds initially appear red. Over time, as the updraft generates and pushes more ice crystals upward, the tops will appear more yellow. Later on, the yellow areas may grow horizontally as small ice crystals fill out the anvil of the storm. Dissipating yellow colours indicate that the updraft is weakening.
The effective use of the severe convection RGB requires that you understand some of the methodology for how the colours would change with an evolving cloud structure. Below you will find a step-wise animation of the growth of thunderstorms and the changes that would occur from the satellite RGB’s perspective.
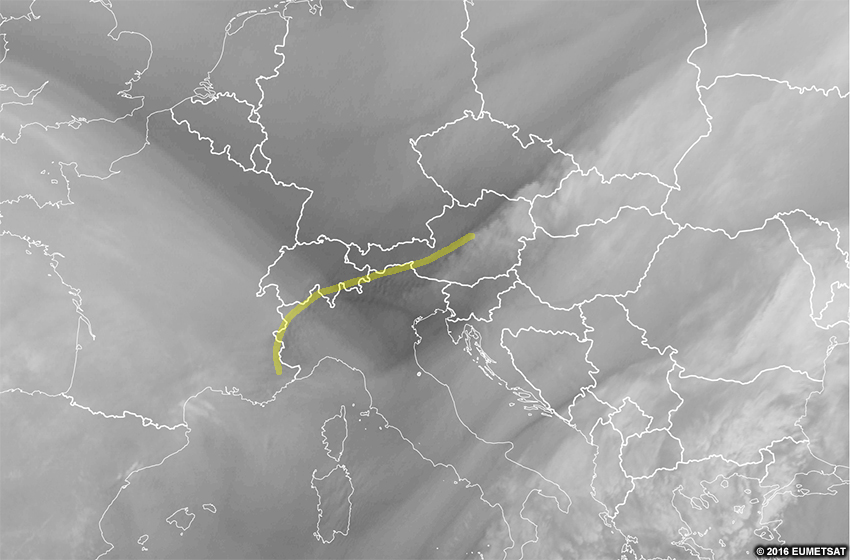
It is important to note that yellow features can also be mountain lee wave clouds, as shown in the loop below, or non-severe high-based thunderstorms, as well as polluted, thick ice clouds.
To determine if yellow features are indeed severe thunderstorms, consult other satellite imagery, and look for the following: pulsing or textured character on IR or visible imagery to confirm severe convection, and uniformly-coloured, smooth cloud tops to confirm mountain lee wave clouds.
Note that polluted, thick, ice clouds are especially hard to determine since the aerosols producing the pollution may not be seen on satellite imagery.
Cloud Heights
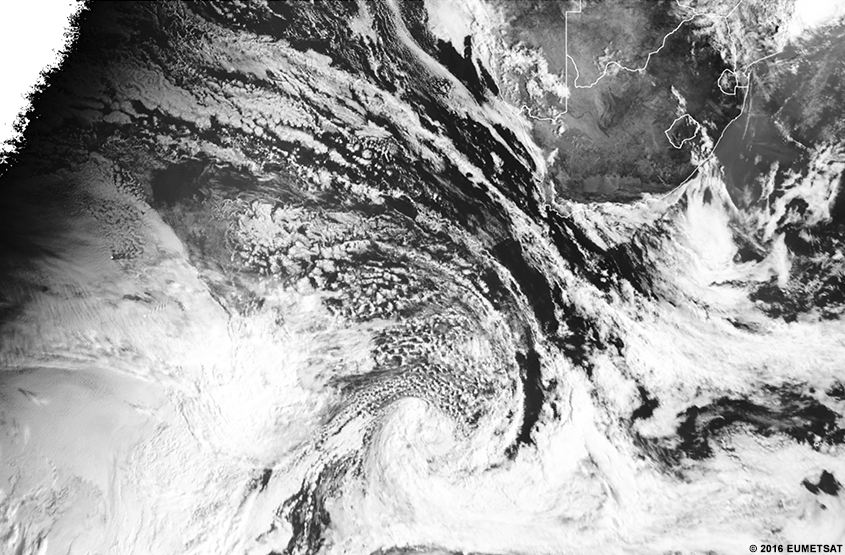
The easiest way to determine a cloud’s height is to use the visible channel to determine its type based on its texture, shape, and shadows. The cloud type then tells you its height.
|
Type of cloud |
Height |
|---|---|
|
Cirrus, cirrostratus, and cirrocumulus |
High clouds at 6000-13000 m (~20000-43000 ft) |
|
Altocumulus and altostratus |
Mid-level clouds at 2000-6000 m (~6500-20000ft) |
|
Stratocumulus and stratus |
Low-level clouds at 0-2000 m (0- ~6500ft) |
This works for most clouds, but not for those with large vertical extent. Cumuliform clouds can be found from 0-13000 m, depending on their stage of development.
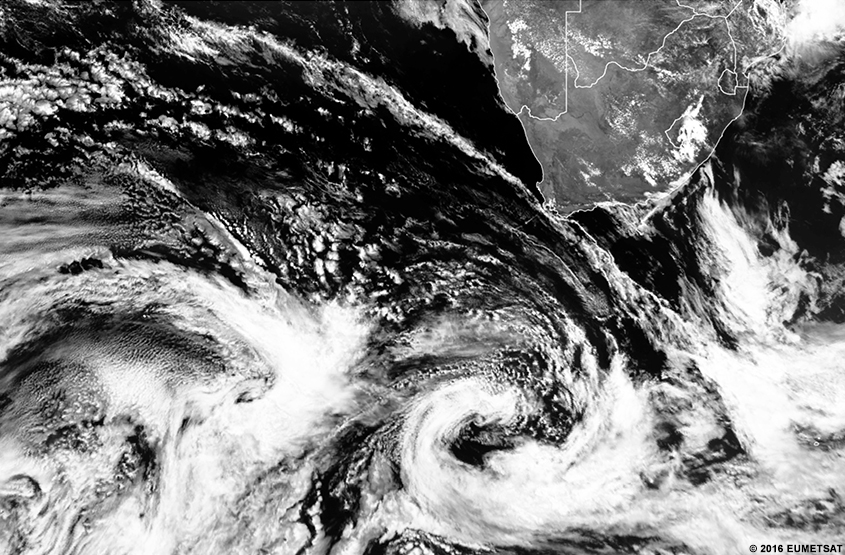
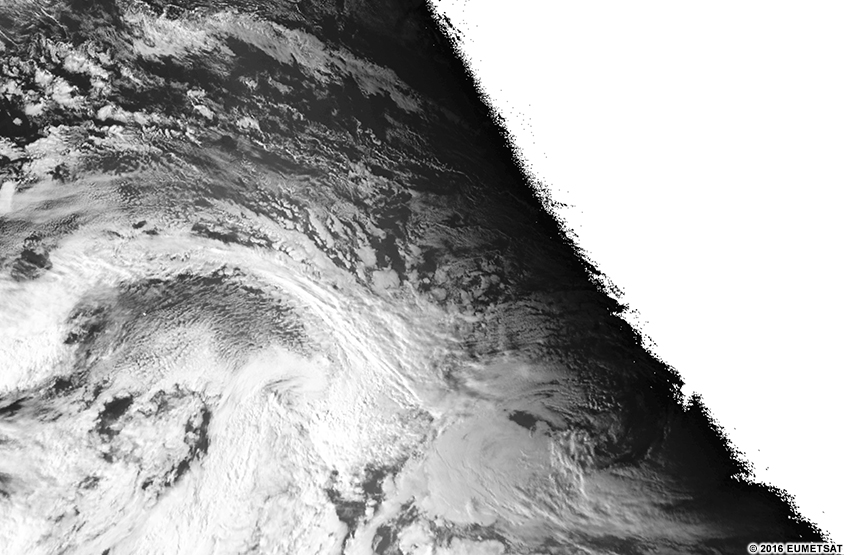
Other factors can complicate cloud identification in visible imagery. For example, as the images below show, sun angle can make the same clouds look dramatically different at different times of day. Knowing where the sun is with relation to the clouds is the only way to combat this effect.
Visible Morning
Visible Mid-day
Visible Evening
There’s another, more quantitative, way to identify cloud heights—using the brightness temperature of clouds in infrared images and RGBs made from those channels. Since IR channels are involved, the technique works during both day and night.
Assuming that tropospheric temperatures decrease with increasing height from the surface, lighter-colored clouds are colder and higher, while darker-colored clouds are warmer and lower. This rule works for both infrared and water vapour imagery. It’s more difficult to define the exact cloud height in RGBs, but we will practice using multiple products together to get an idea if clouds are high or low.

Let’s practice identifying cloud height by using single channel imagery and RGBs and comparing the different products.
Question
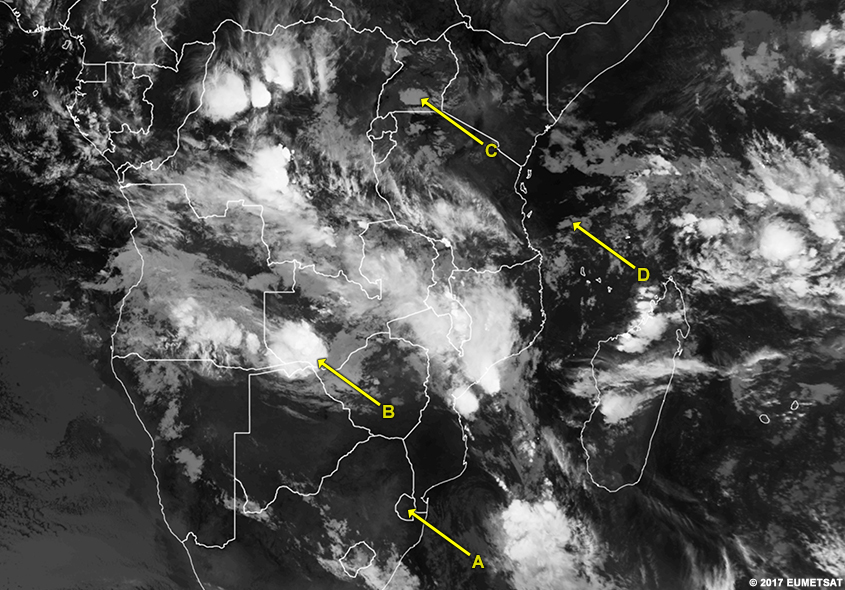
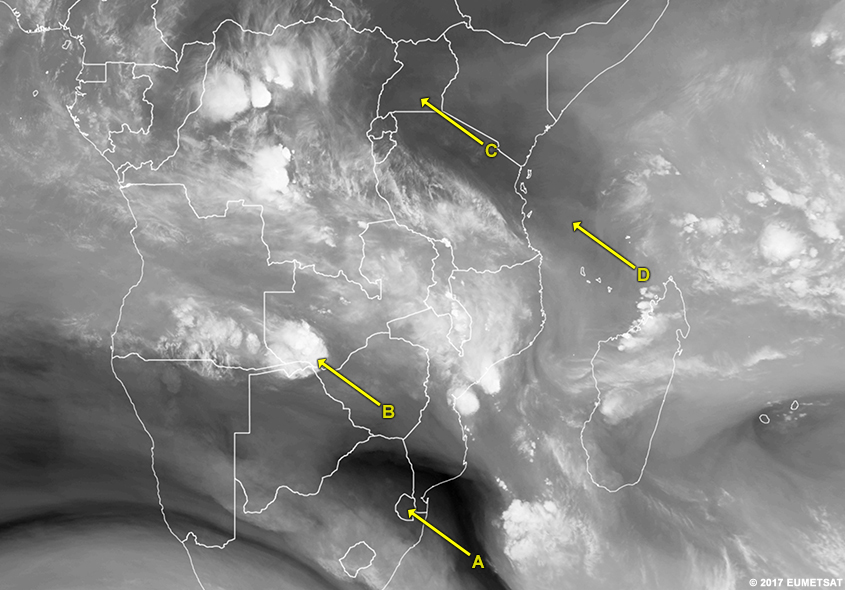
Use the slider to compare the clouds at each location in the four products. Then identify the height of the clouds at each location.
The warm brightness temperatures in the IR and the greenish coloration in the night microphysics RGB tell us that Location A has very low, water clouds. The WV channel and dust RGB cannot detect them since they are too low.
We know that Location B has high clouds since they are bright white in the IR and WV imagery, and red in the night microphysics and dust RGBs.
The clouds at Location C are mid-grey in the IR image and therefore mid-level. They are brownish to yellowish in the night microphysics and dust RGBs but too low to be seen by the WV channel.
The clouds at Location D are mid-grey in the IR imagery, brown in the dust RGB, and pink in the night microphysics RGB. They cannot be seen in the WV image. These clues tell us that the clouds are slightly higher at Location D than Location C but likely still in the middle of the troposphere.
The hardest clouds to differentiate are overlapping clouds - especially where low clouds and/or fog occurs near snow cover. Snow and low clouds often have similar brightness temperatures, especially overnight.
Another difficulty occurs when the upper cloud is very thin. If the upper cloud is more translucent than those below it, the cloud mass brightness temperatures will average out to be warmer and thus at a lower altitude.