SECTION 1: PROJECT OBJECTIVES AND ACCOMPLISHMENTS
A. INTRODUCTION
This COMET outreach project began on 1 June 2000. Our goal was to create, evaluate, and implement a precipitation-type probabilistic forecast system, using ensemble forecasting and consensus forecasting concepts, at the Hydrometeorological Prediction Center (HPC) and the Storm Prediction Center (SPC). The research component of this project evaluated the quality of various precipitation-type algorithms and investigated various ensemble forecasting concepts to present forecast information from a collection of algorithms. The operational component of the project created probabilistic forecasts of each precipitation type diagnosed by the algorithms and consensus forecasts of the most probable precipitation type and made these forecasts available to HPC and SPC forecasters and to the public on the Web. In order to achieve our goal, we set forth six objectives:
During the first year, we concentrated our efforts on (1) developing and transferring existing computer code onto a workstation at HPC, (2) automating the process to run the algorithms, create graphical products, and distribute these products along with complete algorithm output files to forecasters at the HPC and SPC, (3) developing a webpage that contains information about that project and daily algorithm output for the general public and other NWS forecast offices; (4) writing computer code to run daily verification statistics and display this information on the project web site. Our target date to begin providing algorithm output was 1 November 2000. Although some output was available to forecasters on 1 November, the closeness of the project start date (June 1 2000) to November 2000, and the large amount of computer programming that was involved did not allow us to complete all the processing procedures until around January 2001. During the second winter we continued to run the algorithms and make them available to HPC and SPC, as well as real-time verification statistics, and evaluate the quality of the forecast system.
B. ALGORITHMS
For this study, we tested six precipitation-type algorithms using only the thermodynamic data obtained for Eta and RUC model forecasts. All the algorithms, except thickness, use vertical thermodynamic data to identify warm and cold layers above a particular surface location (horizontal movement of the rawinsonde during ascent is not considered) where freezing and melting of a hydrometeor may occur . Most of these algorithms are described elsewhere (Baldwin et al. 1994; Bourgouin 1992; Czys et al. 1996; Ramer 1993), so the description of each algorithm in this paper will be limited. The algorithm written by Cortinas has not appeared previously in a publication, but it is similar to the algorithm written by Czys et al. (1996) except for some modifications.
Thickness (1)
The thickness algorithm diagnoses precipitation type based upon the average
virtual temperature, as determined by the hypsometric equation and the difference
of the geopotential height of two pressure surfaces. This distance is commonly
called the “thickness” of the layer. The bottom and top pressures
of the three tropospheric layers used in this algorithm are:1000 and 850 mb,
850 and 700 mb, and 700 and 500 mb. These mandatory layers have traditionally
been used by forecasters for the purpose of diagnosing (forecasting) precipitation
type.
We assigned the critical thickness
values after examining the studies of Keeter and Cline (1991) and Zerr (1997)
and determining the thickness values that were consistent among the studies.
Using the geopotential height data from the rawinsonde data, we determined the
precipitation type near the ground. Snow was diagnosed if the 850–700
mb thickness was ![]() 1540 m. Rain was diagnosed
if the 1000–850 mb thickness was > 1310 m or if the 850–700 mb
thickness > 1560 m and the surface Tw > 0°C; otherwise, if
the surface Tw
1540 m. Rain was diagnosed
if the 1000–850 mb thickness was > 1310 m or if the 850–700 mb
thickness > 1560 m and the surface Tw > 0°C; otherwise, if
the surface Tw ![]() 0°C, then
the algorithm diagnoses freezing rain. If the 850–700 mb thickness >
1540 m and
0°C, then
the algorithm diagnoses freezing rain. If the 850–700 mb thickness >
1540 m and ![]() 1560 m, then ice pellets
are diagnosed. The algorithm only diagnoses the precipitation type if the geopotential
height data at all four mandatory levels are available (i.e., no extrapolated
data).
1560 m, then ice pellets
are diagnosed. The algorithm only diagnoses the precipitation type if the geopotential
height data at all four mandatory levels are available (i.e., no extrapolated
data).
Ramer (2)
The Ramer algorithm (Ramer 1993) uses p, T, relative humidity,
RH, and Tw to diagnosis snow, freezing rain, ice pellets,
rain, and mixed precipitation. It, too, is based on the ice fraction of the
precipitation at the ground. The algorithm begins by checking Tw at
every available data level. If Tw at the lowest level is ![]() 2°C, then rain is diagnosed; if it is
2°C, then rain is diagnosed; if it is ![]() 2°C and the Tw at every other level is < -6.6°C, then snow
if diagnosed. Other conditions require the algorithm to perform additional calculations
to determine the precipitation type.
2°C and the Tw at every other level is < -6.6°C, then snow
if diagnosed. Other conditions require the algorithm to perform additional calculations
to determine the precipitation type.
The algorithm begins by locating the precipitation generation level, the highest saturated layer (RH > 90%) with a depth of roughly 16 mb. Tw at that level determines the initial water phase of the precipitation: if the coldest Tw is < -6.6°C, then the hydrometeor is entirely ice; otherwise, it is supercooled water. According to the algorithm, if Tw at the generation level is < -6.6°C and the Tw at all the other levels is < 0°C, then snow occurs.
As the hydrometeor descends from the generation level, the algorithm assumes that the particle will begin to melt or freeze depending on the Tw of the hydrometeor’s environment. The ice fraction of the hydrometeor is determined by the formula
dI / d ln (p) = (0°C – Tw) / E, (1)
where E = E’ RH.
Ramer empirically derived the constant, E’=0.045°C , by examining
2084 observations of precipitation that occurred near rawinsonde stations. The
value of I can have a value between 0 (liquid) and 1 (solid). The final
determination of the precipitation type is made by the value of I and
Tw at the lowest level. If I > 0.85, and partial melting has
occurred, then the algorithm diagnoses ice pellets. If no melting has occurred,
then snow is diagnosed. If I < 0.04 and the Tw near the
ground is < 0°C, then freezing rain is diagnosed; otherwise, if the Tw
near the ground is ![]() 0°C, then rain
is diagnosed. If 0.04
0°C, then rain
is diagnosed. If 0.04 ![]() I
I ![]() 0.85 and the surface Tw < 0°C, then a freezing mix (one precipitation
type is freezing rain) is diagnosed; otherwise, a frozen mix (no freezing precipitation)
is diagnosed.
0.85 and the surface Tw < 0°C, then a freezing mix (one precipitation
type is freezing rain) is diagnosed; otherwise, a frozen mix (no freezing precipitation)
is diagnosed.
BTC (3)
The algorithm developed by Baldwin et al. (1994), hereafter referred to as the
BTC algorithm, diagnoses a single precipitation type (e.g., rain, snow, freezing
rain, ice pellets) from an observed thermodynamic vertical profile and currently
is used by the U.S. Weather Service. Although this algorithm uses various empirically-derived
constants, other algorithm variables are used based upon their importance in
the melting and freezing of hydrometeors. The basic procedure used by the algorithm
is to examine the vertical thermal structure that a falling hydrometeor encounters
as it descends to the ground to determine the potential for freezing or melting.
It identifies warm (> 0°C) and cold (![]() 0°C) layers above a particular location by computing the area between 0°C
and the wet-bulb temperature, Tw. The area is computed separately for
warm and cold layers and is used, along with the surface temperature, To, to
determine precipitation type.
0°C) layers above a particular location by computing the area between 0°C
and the wet-bulb temperature, Tw. The area is computed separately for
warm and cold layers and is used, along with the surface temperature, To, to
determine precipitation type.
The algorithm begins by determining
if precipitation initially begins as supercooled water or ice. The precipitation
generation level is assumed to exist at the highest saturated layer (T –
Td < 6°C). Next, it computes the area between –4°C and
Tw up to 500 mb, and the area between 0°C and Tw of the
surface-based warm or cold layer. The algorithm diagnoses snow if the coldest
temperature at any level with a pressure, p, of 500 mb or greater is ![]() -4°C, and the area of the sounding between –4°C and Tw
is not large (< 3000 deg. m).
-4°C, and the area of the sounding between –4°C and Tw
is not large (< 3000 deg. m).
The algorithm diagnoses freezing
rain when the coldest temperature in a saturated layer is > -4°C and
To is < 0°C. Freezing rain also is diagnosed if the net area,
with respect to 0°C, of the surface-based layer is > -3000 deg. m, the
area between –4°C and Tw > 3000 deg. m, and To
is ![]() 0°C.
0°C.
If the coldest Tw in a
saturated layer is ![]() -4°C, and the area between –4°C and Tw is > 3000 deg.
m, then ice pellets are diagnosed when the surface-based cold layer is
-4°C, and the area between –4°C and Tw is > 3000 deg.
m, then ice pellets are diagnosed when the surface-based cold layer is ![]() -3000 deg. m, or the net area between 0°C and Tw within the lowest
150 mb is
-3000 deg. m, or the net area between 0°C and Tw within the lowest
150 mb is ![]() -3000 deg. m and the surface-based warm layer is < 50 deg. m.
-3000 deg. m and the surface-based warm layer is < 50 deg. m.
Rain is diagnosed when the coldest Tw in a saturated layer is > -4°C and To is > 0°C. Rain is diagnosed also when To > 0°C and the area between –4°C and Tw is > 3000 deg. m, and the net area between 0°C and Tw within the lowest 150 mb is > -3000 deg. m, or the surface-based warm layer is > 50 deg. m.
Bourgouin (Canada)(4)
The algorithm developed by Bourgouin (1994) is similar to the BTC algorithm
and determines if enough energy is available in the environment to melt or freeze
hydrometeors. It computes the areas bounded by 0°C and the observed temperature
> 0°C (melting energy) and the observed temperature < 0°C (freezing
energy) on a standard tephigram. The Bourgouin algorithm determines precipitation
type by examining the magnitude of the melting and freezing energies: Snow occurs
when the melting energy of a surface-based layer is ![]() 5.6 J kg-1 or the melting energy available in a mid-level warm layer
(a warm layer above a surface-based cold layer) is < 2 J kg-1
when no surface-based warm layer is present. If the surface-based melting energy
is between 5.6 and 13.2 J kg-1, Bourgouin notes that frozen and melted
precipitation are equally likely, so we randomly choose either snow or rain.
Rain will also occur if the elevated layer of melting energy is < 2 J kg-1
and the surface-based melting energy is > 13.2 J kg-1.
5.6 J kg-1 or the melting energy available in a mid-level warm layer
(a warm layer above a surface-based cold layer) is < 2 J kg-1
when no surface-based warm layer is present. If the surface-based melting energy
is between 5.6 and 13.2 J kg-1, Bourgouin notes that frozen and melted
precipitation are equally likely, so we randomly choose either snow or rain.
Rain will also occur if the elevated layer of melting energy is < 2 J kg-1
and the surface-based melting energy is > 13.2 J kg-1.
If snow is not diagnosed, the algorithm
diagnoses freezing rain if the freezing energy < 46 + 0.66 X melting energy.
Although not suggested by Bourgouin (1994), we also require To <
0°C; otherwise, if To ![]() 0, then rain is diagnosed. Ice pellets occur when the freezing energy > 66
+ 0.66 X melting energy and the surface-based melting energy is = 5.6 J kg-1.
As in the snow diagnosis, if the surface-based melting energy is between 5.6
and 13.2 J kg-1, Bourgouin notes that both types are equally likely,
so we choose randomly either ice pellets or rain. Also, Bourgouin notes that
for any freezing energy between 46 + 0.66 X melting energy and 66 + .66 X melting
energy, there is an equally probable chance of freezing rain or ice pellets.
In these cases, we randomly choose either type, subject to the proper To or
surface-based melting energy test described previously. The various constants
were empirically chosen by Bourgouin (1994) after examining cases during the
1989-1990 and 1990-1991 cold seasons.
0, then rain is diagnosed. Ice pellets occur when the freezing energy > 66
+ 0.66 X melting energy and the surface-based melting energy is = 5.6 J kg-1.
As in the snow diagnosis, if the surface-based melting energy is between 5.6
and 13.2 J kg-1, Bourgouin notes that both types are equally likely,
so we choose randomly either ice pellets or rain. Also, Bourgouin notes that
for any freezing energy between 46 + 0.66 X melting energy and 66 + .66 X melting
energy, there is an equally probable chance of freezing rain or ice pellets.
In these cases, we randomly choose either type, subject to the proper To or
surface-based melting energy test described previously. The various constants
were empirically chosen by Bourgouin (1994) after examining cases during the
1989-1990 and 1990-1991 cold seasons.
CSTPS (5)
The algorithm developed by Czys et al. (1996), hereafter referred to as CSTPS,
was developed to distinguish primarily between ice pellets and freezing rain
environments by predicting the ice portion of a single ice sphere as it descends
to the ground through a given thermodynamic profile. We made minor modifications
to this algorithm to also predict snow and rain as well.
Precipitation type is determined primarily by computing the ratio, ‚, of the time that an ice sphere remains in the warm layer (the residence time), and the time necessary to completely melt the sphere: If ‚= 0, then no melting occurs; If 0 < ‚< 1, then partial melting occurs; If ‚ = 1, then complete melting occurs. The algorithm determines the residence time by dividing the warm layer depth by the terminal velocity of the hydrometeor (assuming the vertical velocity of the air is zero). For their test case, Czys et al. (1996) used radar reflectivity data during a U.S. ice storm to determine the initial radius (400 microns) of the ice sphere. The algorithm estimates the time that is needed to completely melt the particle from a balance between the release of latent heat from melting and the rate of heat transfer through its liquid water shell. It uses three characteristics of the elevated warm layer: average depth, average pressure, and average Tw, to determine the melting time. In this study we do not require an elevated melting layer in order to use this algorithm since we believe that the physical processes upon which the algorithm is based also occur in surface-based melting layers.
According to the CSTPS algorithm, ice pellets occur if 0 < ‚< 1 for any value of To, where To is the ground temperature or lowest wet-bulb air temperature. Freezing rain occurs if ‚> 1 and To is = 0°C; if To > 0°C, then rain occurs. Snow occurs if there is no melting layer, ‚ = 0.
Cortinas (6)
The Cortinas algorithm, like CSTPS, attempts to determine if a single frozen
hydrometeor melts completely as it descends through any melting layer. Although
there are some minor differences between some of the equations used in the Cortinas
algorithm and those used in the CSTPS algorithm, the major difference is that
the Cortinas algorithm does not use the characteristics of the warm layer (i.e.,
depth and average temperature); instead, the entire thermodynamic profile below
500 mb is used to compute the melting rate of the ice sphere that is the same
size as the one used in CSTPS. The algorithm determines the precipitation type
based upon the size of the ice sphere at the ground.
For any To, ice pellets occur if there has been some melting but some ice still exists when the particle reaches the bottom of the melting layer. If the particle melts completely and the To = 0°C, then freezing rain occurs; if the To is > 0°C, then rain occurs. Snow occurs if there is no melting layer.
This algorithm was not run in the operational system because it is too computationally intensive. The trivial exception to this occurs if this along with all of the other algorithms is assigned a precipitation type of rain when T > 5°C throughout the lowest 1000 m of the atmosphere.
C. ALGORITHM EVALUATION WITH RAWINSONDE DATA
Since the ultimate goal of this project was to use these algorithms with model output to generate forecasts, it is important to understand that quality of the precipitation-type forecasts depends on the quality of the algorithms and the quality of the numerical forecast. In order to determine the accuracy of the algorithms, we tested each algorithm by identifying Canadian and American rawinsonde launch locations that reported rain with a surface air temperature of 5°C or less, snow, freezing rain, or ice pellets from 1976 to 1990 at the balloon launch time, 11 or 23 UTC. Using these criteria, we selected 1828 observations to use for testing: 627 observations of snow, 191 observations of ice pellets, 387 observations of freezing rain, and 623 observations of rain. Observations of more than one type of precipitation occurring simultaneously were not included.
We evaluated each algorithm according to the methodology described above and have listed those algorithms, except the thickness algorithm, with the best value for each statistic (Table 1). We do not include the thickness algorithm in our quality evaluation since it could not diagnosis a precipitation type for 65% of the cases (no 1000 mb level available). Instead, the statistics for the thickness algorithm are reported separately (Table 2). We determined the quality of each algorithm by counting how often each algorithm appeared in the POD and FAR columns of table 2. We choose to use POD and FAR since the complete specification of the quality measure requires more than one scalar measure (Murphy 1991). Using our evaluation criteria, the Ramer algorithm (2) and the CSTPS algorithm (5) are the most accurate algorithms since they appear most often in columns two and three.
TABLE 1: Algorithm number(s) (as defined by the subsection numbers in section 3) and the quality measure value (in parentheses) for each precipitation type.
TS |
POD |
FAR |
BIAS |
|
SN |
5 (0.8) |
2,5(0.8) |
3,4,5,6(0.01) |
5(0.9) |
IP |
3(0.2) |
2(0.5) |
5(0.5) |
6(0.6) |
FZRA |
2,3,6(0.6) |
3,4,5,6(0.9) |
2(0.3) |
2(1.2) |
RA |
2,4(0.8) |
3,4,5,6(0.9) |
2,4(0.1) |
2,3,4(1.0) |
TABLE 2: Quality measures for the thickness algorithm. (TS = threat score; POD = probability of detection; FAR = false alarm ratio; BIAS = bias).
TS |
POD |
FAR |
BIAS |
|
SN |
0.5 |
0.5 |
0.02 |
0.5 |
IP |
0.1 |
0.3 |
0.8 |
1.2 |
FZRA |
0.4 |
0.9 |
0.6 |
2.1 |
RA |
0.3 |
0.9 |
0.7 |
2.8 |
The statistic results indicate that the algorithms diagnose ice pellets and freezing rain with less quality than snow and rain. Ideally, a high quality diagnostic or forecast system has a large POD and a small FAR. In the case of ice pellets, the Ramer algorithm correctly diagnosed ice pellets 50% of time they were diagnosed and the CSTPS algorithm diagnosed ice pellets 50% of time they actually occurred. These results indicate that any individual algorithm unlikely will provide a high quality diagnosis of ice pellets for most events.
An examination of the quality measures for each algorithm (not shown), however, shows that in some cases, the difference between the measure of the best and the next best algorithm was less than 10%. This suggests that none of the algorithms should be considered absolutely inaccurate, but, instead, a probabilistic diagnosis using all the algorithms may prove more accurate than any one particular algorithm during some events.
D. PRECIPITATION-TYPE ALGORITHM EXPERIMENT (PTAX)
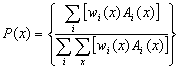
During PTAX, many graphical products were created for forecasters to use and evaluate with NAWIPS. The algorithm suite was run for each Eta run (every six hours) and each RUC run (every three hours) for roughly 600 and locations across the US and southern Canada (Fig. 1). These forecasts were output as: (1) maps of precipitation type by forecast hour and algorithm, including forecast multihour precipitation accumulation; (2) probabilistic forecasts for each precipitation type were created for each forecast hour and location, by using the weights in Table 1; (3) the "most likely" precipitation type graphic was a plot of the weather symbol of the precipitation type with the highest forecast probability.
The probabilistic forecast for each type of precipitation was computed using all available algorithm output. (Recall that algorithms 1 and 6 would not always produce output given particular conditions described in the previous section.) Using hourly model sounding data, each algorithm produced a precipitation-type forecast. Probabilities were assigned to each type by using a weighted sum of the algorithm output. Since each algorithm, A(i), diagnoses a particular precipitation type, x, the probability of precipitation type, x, over the entire ensemble of algorithms is P(x),
 (1)
(1)
where wx(i) is the weight assigned to algorithm A(i) for type x. The value of A is 1 or 0, depending on whether A(i) diagnosed the precipitation type x or another precipitation type. The weights were based upon a preliminary evaluation of these algorithms using observed soundings across North American from 1976 to 1990 (Table 1).
Table 1. Weights used in current study
Algorithms |
|||||||
1 |
2 |
3 |
4 |
5 |
6 |
||
Precipitation |
Rain |
1 |
2 |
1 |
1 |
1 |
1 |
Snow |
1 |
1 |
1 |
1 |
2 |
1 |
|
Ice Pellets |
1 |
1 |
2 |
1 |
1 |
1 |
|
Freezing
Rain |
1 |
2 |
1 |
1 |
1 |
1 |
|
Undetermined |
1 |
2 |
1 |
1 |
1 |
1 |
|
Mixed |
1 |
2 |
1 |
1 |
1 |
1 |
|
a.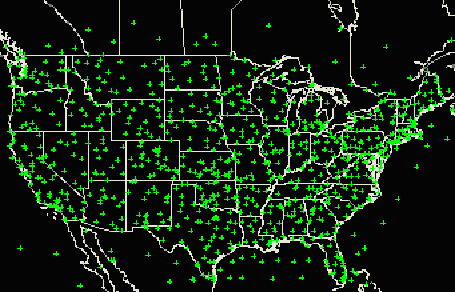
b.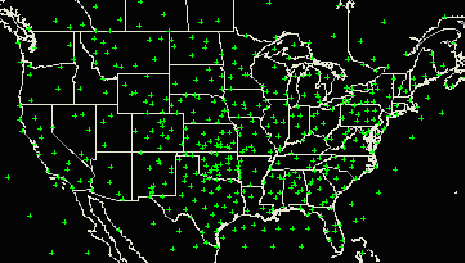
Figure 1. Locations where (a) Eta and (b) RUC data were used as algorithm input.
Precipitation type forecasts were generated for each location.
In addition to the probabilistic output by precipitation type, the most probable type at a particular location and model valid time was obtained by identifying the type associated with the highest P(x). If P(x) for one type was equal to the P(x) for another type, then a hierarchical ordering of snow, rain, freezing rain, ice pellets was used to determine the most probable type.
The forecast quality of the algorithms,
using Eta model output, and the most probable precipitation type were assessed
by constructing a standard contingency table for each type of precipitation
using model data every three hours. For the RUC output, the forecast hours were
1, 2, 3, 6, 9, and 12. Algorithm output using Eta and RUC forecast soundings
from November 2000 to March 2001 and November 2001 to March 2002 were compared
to surface observations of precipitation type at +/- 1 hour of the model valid
time. Only those locations where precipitation was observed and forecasted were
verified since the algorithms were developed originally to be used at locations
where precipitation is occurring. Additionally, the rain forecasts were only
verified against observations of rain where To ![]() 5°C,
since forecasting rain at these temperatures can be most difficult. For the
evaluation period, numerous verification statistics were computed, namely, probability
of detection (POD), false alarm rate (FAR), bias, threat score, Heidke skill
score, and Kuipers skill score. Only POD and FAR will be shown in this report.
(The full set of performance measures will be included in a formal publication
that is currently being prepared.)
5°C,
since forecasting rain at these temperatures can be most difficult. For the
evaluation period, numerous verification statistics were computed, namely, probability
of detection (POD), false alarm rate (FAR), bias, threat score, Heidke skill
score, and Kuipers skill score. Only POD and FAR will be shown in this report.
(The full set of performance measures will be included in a formal publication
that is currently being prepared.)
An analysis of the POD (Fig. 2) and FAR (Fig. 3) for algorithms 2-5 with Eta data and each precipitation type shows that there is no particular algorithm that has the highest (lowest) POD (FAR) for all times and all precipitation types. Results for the thickness algorithm are not included in the plots since it was only applicable to less than 50% of the forecasts of algorithms 2-5. For the thickness algorithm, the median POD (FAR) values for snow, ice pellets, freezing rain, and rain were 0.39 (0.18), 0.6 (0.95), 0.0 (1.0), and 0.88 (0.11) respectively for all forecast times. Problems with computer resources prevented us from running algorithm 6 during the experiment. However, the algorithm will be evaluated and the results included in a manuscript that is being written now. The plots indicate that the forecast accuracy for rain and snow is relatively good; the accuracy of the ice pellet forecasts is poor; and the accuracy of the freezing rain forecasts is only slightly better than the ice pellet forecasts. Surprisingly, the forecast accuracy remains nearly constant for rain and snow, and decreases only slightly as the forecast hour increases for ice pellets and freezing rain. A similar result is found for the RUC forecasts (Figs. 4 and 5).
An alternate method of combining model output to provide a probabilistic forecast was also used to evaluate the effect of different methodologies of generating probabilistic output. Despite the fact that the accuracy of one algorithm is not consistently superior to the others, it is important to note that the most probable type forecast ranks in the upper-half of the algorithms for all types, except ice pellets. This provides some evidence that ensemble forecast techniques may be useful when forecasting precipitation type.
Fig. 2 POD score for (a) rain (RN), (b) snow (SN), (c) ice pellets (IP), and
(d) freezing rain(ZR) using 3-hrly Eta model output from all 0 and 12 UTC runs
between November 2000 and March 2002 (roughly 380,000 forecast points). The
algorithm number is indicated in each plot as well as the most probable (MPROB)
output. Thickness algorithm values are not included since some data were not
available for all the same times as algorithms 2-5.
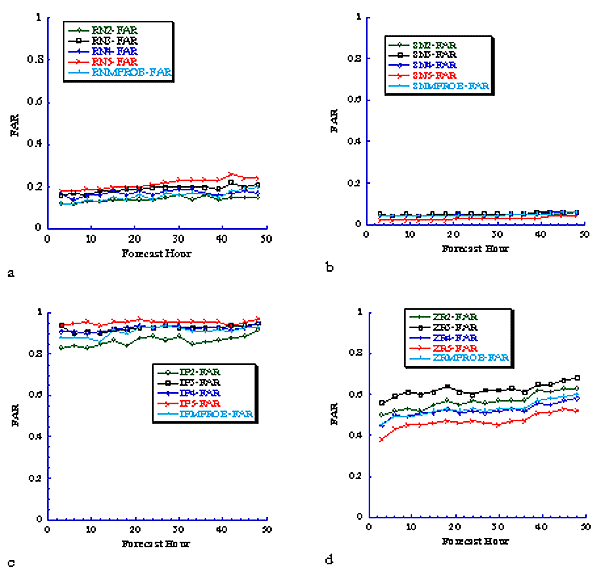
Fig. 3 Same as Fig. 2, except for False Alarm Ratio (FAR)
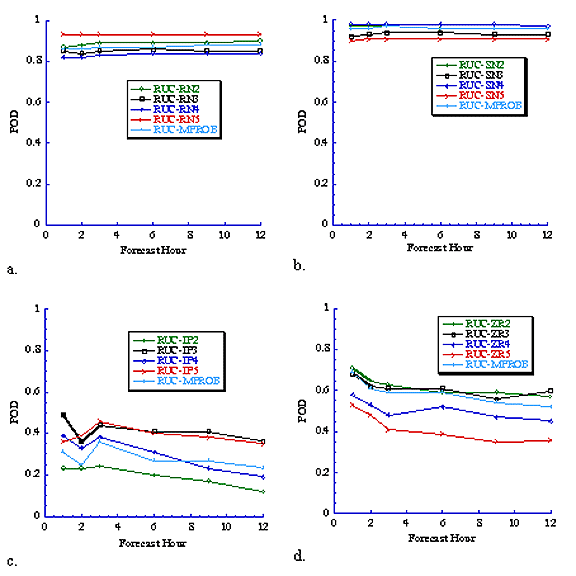
Fig. 4 POD score for (a) rain (RN), (b) snow (SN), (c) ice pellets (IP), and
(d) freezing rain (ZR) using RUC model output from all 0 and 12 UTC runs between
November 2000 and March 2002. The algorithm number is indicated in each plot
as well as the most probable (MPROB) output. Thickness and algorithm values
are not included since some data were not available for all the same times as
algorithms 2-5.
.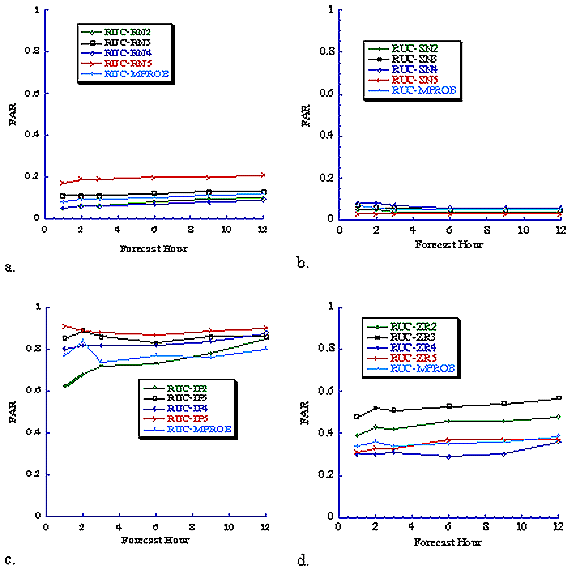
Fig. 5 Same as Fig. 4, except for False Alarm Ratio (FAR)
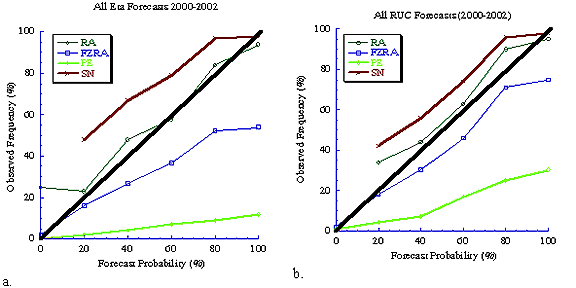
Fig. 6 Reliability diagrams for probabilistic precipitation-type forecasts using
(a) Eta and (b) RUC model output. Data for 0% rain (Eta and RUC) and freezing
rain (Eta) data is missing because of an error discovered in the analysis of
these data. The solid black line indicates a reliable forecast.
An examination of the probabilistic forecasts reveals that snow, rain, and freezing rain forecasts are usually reliable, whereas ice pellet forecasts are not (Fig. 6). These results also show that this forecast system overforecasts snow and rain, and underforecasts freezing rain and ice pellets.
Additional research that has occurred because of this COMET-sponsored project is the evaluation of the performance of this forecast system using data from the EMC short-range ensemble experiment. The variety of precipitation-type algorithms allows for the accommodation of uncertainty in determining the phase of a falling hydrometeor given a particular model sounding. However, there is a great deal of uncertainty associated with those model soundings. Therefore, just as a suite of algorithms can be employed, so too can be employed a suite of different models upon which the algorithms work. All six algorithms were used along with 10 members of the NCEP Short-Range Ensemble Forecast system to make probabilistic forecasts of precipitation type for 46 cases between January and March of 2002 (Fig. 7). Attributes diagrams convey information about the skillfulness of probabilistic forecasts by plotting the forecast probabilities against the frequency of occurrence for the times when that forecast probability was issued. A perfectly reliable forecast (e.g., an event occurs 70% of the time a forecast of 70% is issued) results in a curve along the 45º line. The lower diagonal is the no-skill line, while the vertical and horizontal lines denote the sample climatology.
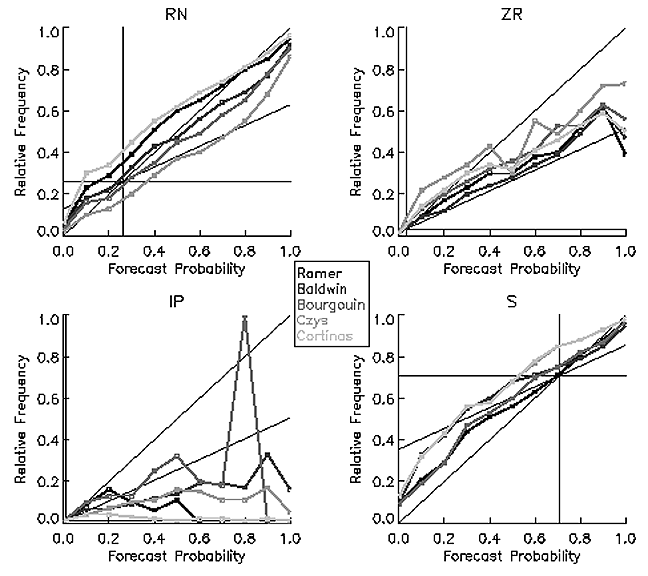
Figure 7 Attributes diagrams for forecasts using selected runs of the NCEP short-range
ensemble and all six precipitation-type algorithms.
As expected, the algorithms perform much better for the rain (RN) and snow (S) forecasts than for the freezing rain (ZR) and ice pellet (IP) forecasts. Snow is underforecasted (the curves lie above the 45º diagonal) by all of the algorithms except at the highest probabilities, while ice pellets are strongly overforecasted particularly by the Cortinas algorithm. Freezing rain is mostly overforecasted, but the Czys algorithm underforecasts for the lower probabilities. The forecasts of rainfall vary greatly between a strong overforecast by the Czys algorithm to a moderate underforecast by the Cortinas and Ramer algorithms. Most importantly, no single algorithm outperforms all others for each of the precipitation types. For example, the Baldwin algorithm performs very well for rainfall but does rather poorly for freezing rain events. This highlights the importance of utilizing the different available approaches to achieve a combined forecast that is superior to any of the individual methods. The results of this project will be reported in a companion paper to the formal paper describing the PTAX results.
E. SUBJECTIVE EVALUATION
In addition to the quantitative evaluation of these algorithms, there was a subjective evaluation, as well. During the operational component of the first year, HPC and SPC forecasters were asked to complete an online evaluation form. This form was used to provide a subjective assessment of the graphical products usefulness for creating the HPC or SPC winter weather forecast products. The evaluation form asked many questions:
(1) Were any precipitation-type products used? If not, why not?
(2) Which model output was used?
(3) Which products were used?
(4) Were the products you wanted to see available on time?
(5) Did the predicted precipitation types seem correct?
(6) How would you evaluate the usefulness of the ptype product (useless, useful, very useful, extremely useful)?
The results of the forecaster evaluation show that the forecasters found this precipitation type output useful to extremely useful 92% of the time it was used (Fig. 8). Forecasters preferred using the "most likely" precipitation type graphic with Eta output (probably because of the lead time needed for HPC forecast products). These products usually were available on time, which may have contributed to the rapid acceptance of these products by the forecasters. Based on a subjective evaluation, forecasters believed that the precipitation-type forecasts were correct.
During the second year of the experiment, forecasters answered a shorter questionnaire with the following questions:
(1) Were any precipitation-type products used? If not, why not?
(2) Which products were used and what was your confidence in them?
(4) Were the products you wanted to see available on time?
(5) Did you look at the current verification statistics?
(6) Did the verification statistics influence your forecast?
(7) Comments on the verification statistics?
Since forecaster responses from
the first year clearly indicated that the forecasters found these products useful,
we focused on the use of verification products to influence forecasters' level
of confidence about a particular precipitation-type product. Of the 101 responses
during the second year of the experiment, 69% of the evaluations indicated that
the forecaster used the precipitation-type output to create a forecast product.
The remaining evaluations did not use the algorithm output because the forecast
was a clear case of rain or snow or the output was not available (products were
unavailable for 7% of the evaluations). The most probable precipitation type
product continued to be used most frequently, with 93% of the evaluations that
used the algorithm output indicating use of this product. Forecasters gave this
product an average confidence rating of 4 (5 was defined as the highest level
of confidence.) The other two products, individual algorithm output and the
probabilistic output by precipitation type were used 40% and 42% of the time.
Only 5% of the evaluations indicated that the verification data were used. We
believe that forecasters did not look at the verification data or that it influenced
their forecast because of the lack of training in the use of verification data
and proper documentation. Some forecasters commented that they were unaware
of how to locate the verification statistics.
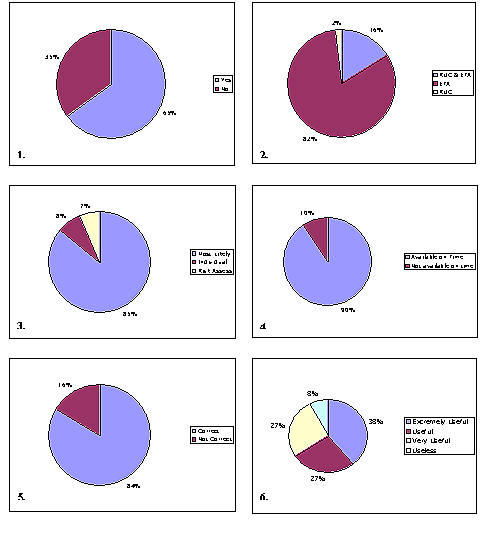
Figure 8. Responses to 2000 forecaster evaluations. Numbers shown in the lower
left-hand corner indicate the question number (shown before figure).
F. VERIFICATION SYSTEM
As part of this project, a real-time verification system was created and the output was provided on the web for forecasters to use. The forecaster evaluations indicate that these statistics were rarely used. We believe that there are several reasons for this: (1) lack of proper forecaster training on the use of verification data in forecasting, (2) insufficient notification and reminders to forecasters that these data were available, and (3) too much information for forecasters to use effectively.
G. REFERENCES
Baldwin, M., R. Treadon, and S. Contorno, 1994: Precipitation type prediction using a decision tree approach with NMCs mesoscale eta model. Preprints, 10th Conf. On Numerical Weather Prediction, Portland, OR, AMS 30–31.
Bourgouin, P., 2000: A method to
determine precipitation type. Wea. Forecasting, 15, 583–592.
Czys, R., R. Scott, K.C. Tang, R. W. Przybylinski, and M. E. Sabones, 1996:
A physically based, nondimensional parameter for discriminating between locations
of freezing rain and ice pellets. Wea. Forecasting, 11, 591–598.
Keeter, K., and J. Cline, 1991: The objective use of observed and forecast thickness values to predict precipitation type in North Carolina, Wea. Forecasting, 6, 456–469.
Murphy, A., H., 1991: Forecast verification: its complexity and dimensionality. Mon. Weather Rev., 119, 1950–1601.
Ramer, J., 1993: An empirical technique for diagnosing precipitation type from model output. Preprints, 5th International Conf. On Aviation Weather Systems, Vienna, VA, AMS, 227–230.
Zerr, R. J., 1997: Freezing rain: An observational and theoretical study. J. Appl. Meteor., 36, 1647–1660.
SECTION 2: SUMMARY OF UNIVERSITY/ NWS EXCHANGES
Because of the nature of this project, the investigators at both organizations maintained frequent communication throughout the project. The primary mechanism of communication was by e-mail and telephone since the distance between Norman, Oklahoma, and Camp Springs, Maryland, precludes frequent face-to-face meetings. Since the investigators have tried to avoid excessive travel, one meeting was conducted through videoconferencing hardware available at the HPC and the SPC. Three seminars were given to SPC and HPC forecasters: SPC Seminar (September, 2000), HPC Seminar (Fall, 2000), and Joint SPC/HPC Seminar (Spring 2001).
SECTION 3: PRESENTATIONS AND PUBLICATIONS
Presentations by John Cortinas:
HPC Senior Forecaster Mike Eckert delivered a presentation on the use of the PTAX output during the 10th Great Lakes Operational Meteorological Workshop in Cleveland, OH (2-4 October 2001). The title of his presentation was "New Tools for Forecasting Winter Precipitation Type."
On 12 December 2002, HPC forecaster Wes Junker made a presentation at the EMC Program Review as representative of the HPC. On the basis of the verification statistics for the algorithms and HPC forecaster experience using the algorithms, he proposed that the EMC consider using the Ramer algorithm in place of the current NCEP algorithm in the operational models. This suggestion motivated the Mesoscale Modeling Branch of the EMC to implement experimental output from the operational Eta model comparing the Ramer algorithm and a modified version of the NCEP algorithm with the current NCEP algorithm precipitation type output along with the ice fraction output from the Eta model cloud scheme. This output is now available to HPC forecasters via an EMC web page.
Publications:
Cortinas, J.V., Jr., and M. E. Baldwin, 1999: A preliminary evaluation of six precipitation-type algorithms for use in operational forecasting. Proceedings, 6th Workshop on Operational Meteorology, Halifax, Nova Scotia, Environment Canada, 207-211
Cortinas, J.V., Jr., K. F. Brill, M. E. Baldwin, 2002: Probabilistic forecasts of precipitation type. Preprints, 16th Conf. on Probability and Statistics in the Atmospheric Sciences, Orlando, FL, AMS, 140-145.
Cortinas, J.V., Jr., K. F. Brill, and M. E. Baldwin, 2003: A statistical evaluation of five precipitation-type algorithms for use in operational forecasting. Part I: Basics and implementation. Wea. and Forecasting, in progress.
Wandishin, M., J.V. Cortinas, Jr., K. F. Brill, and M. E. Baldwin, 2003: A statistical evaluation of five precipitation-type algorithms for use in operational forecasting. Part II: An ensemble approach. Wea. and Forecasting, in progress.
SECTION 4: SUMMARY OF BENEFITS AND PROBLEMS ENCOUNTERED
Benefits to the University
This project provided several important benefits to the university. As a result of this COMET project, the university participants have been able to test and transfer research results into an operational setting more quickly than through other types of projects (e.g., NSF-sponsored projects). This project has provided financial resources for the university investigators to pursue an applied research project at a time when funding for applied research is scarce. The investigators also have gained a greater appreciation of time and information limitations within the operational forecasting environment. Most importantly, this project has given the investigators extremely valuable feedback from forecasters at two NWS national centers. The exposure to the operational environment and interaction with forecasters and research staff at these centers will ultimately help the investigators develop of an efficient forecast system for use in many types of operational and research settings. Without these valuable interactions with the NWS, the university investigators alone probably could not develop a system that works in an operational environment as efficiently as the current system does.
No major problems were encountered with the interaction. With regard to the experiment the only major problem was the lack of computer resources to run algorithm 6 in realtime.
Benefits to the NWS
The products generated by this experiment have been very beneficial to operations both in the National Centers for Environmental Prediction (NCEP) HPC and the SPC. In December 1999, the HPC began issuing a suite of products forecasting probabilities of snow and ice in terms of low, moderate, and high risk. The precipitation type algorithm output has proven very useful in making these forecasts. In the fall of 2001, the HPC began a Winter Weather Experiment (WWE) to use an ensemble approach as part of a collaborative effort with field offices in the National Weather Service (NWS) Eastern Region to improve winter weather forecasting. The WWE continued in 2002 with additional participants in the NWS Central Region. In the second year of the WWE, the WWE forecaster was responsible for the suite of winter weather risk products, making the ensemble of algorithms an even more integral part of the WWE than was the case during the previous winter.
In addition to the direct benefit of providing guidance for operational products, the PTAX products gave the forecasters experience in thinking in terms of ensemble based guidance tools before the Short Range Ensemble Forecast (SREF) system was available. Although the SREF has been the major focus for the WWE, the PTAX output offers a different perspective on the forecast problem due to the use of the different precipitation-type algorithms. Through training and experience, the forecasters have come to appreciate this perspective and use it to advantage.
Problems
Although the PTAX processing is done outside of the operational production suite of jobs on the NCEP supercomputer, it executes on the production side of the machine. The PTAX processing makes use of multiple nodes to speed delivery of the guidance. The reliability of this delivery has been quite high. There have been very few problems with product generation. This reliability has contributed to the success of PTAX products in the operational arena