SECTION 1.1: PROJECT OBJECTIVES AND ACCOMPLISHMENTS
Work to date has focused on statistical procedures needed to create operational maximum and minimum temperature forecasts for selected Cooperative Observer Program (COOP) sites within the forecast zones of responsibility of the Albany National Weather Service Forecast Office (WFO). This procedure will become necessary as future NWS forecasting improvements will include forecast verification by zone. The operational problem is how to forecast for specific COOP stations, given that existing guidance products are only generally available for selected National Weather Service/Federal Aviation Administration (NWS/FAA) locations. COOP stations exist in each zone and will be used as the main source for maximum and minimum temperature data specific to each zone. Linear regression equations are in the process of being developed and tested for the individual COOP sites based on observed and forecast conditions at Albany. Eventually, forecast regression equations will be developed for maximum and minimum temperature stratified by weather regime and elevation.
Initially we have selected several COOP site locations within the Albany WFO zones for a three-month test period in developing linear regression equations. The COOP sites include Cairo (Greene County), East Jewett (Greene County), and Gloversville (Fulton County), and the three-month period is from 1 May 1999 through 31 July 1999. Eventually, the dataset will be expanded to include temperature data for the entire 1995-1999 period. To date, four different linear regression equations have been developed. The first, using Albany observed maximum temperatures versus the individual COOP sites' maximum temperatures; the second, using Albany observed minimum temperatures versus the individual COOP sites' minimum temperatures; the third, using Albany Model Output Statistics (MOS) maximum temperatures versus the individual COOP sites' maximum temperatures; and the fourth, using Albany MOS minimum temperatures versus the individual COOP sites' minimum temperatures.
Preliminary results have indicated that in general, maximum temperatures have shown a better correlation than the minimum temperatures when comparing the COOP sites to Albany. For example, in comparing Cairo's temperatures with Albany's observed temperatures, the maximum temperatures for the three-month test period correlated very well, with a value of 0.9507 for the square of the correlation coefficient (R2). However, the minimum temperatures yielded a value of only 0.8284 for R2.
Initial results are now summarized in tabular and graphical form for comparisons between Albany observed temperatures (predictor) and Albany NGM MOS forecast temperatures, (predictand), between Albany observed temperatures (predictor) and COOP site observed temperatures (predictand) at Cairo, Gloversville, and East Jewett, NY, and between Albany NGM MOS forecast temperatures (predictor) and COOP site observed temperatures (predictand) for the same three locations.
It is hypothesized that stratification by weather regime and elevation will help account for the variability in the minimum temperatures. Future research will test this hypothesis.
|
ALB observed
vs. ALB NGM MOS forecast
|
||
| Tmax | Tmin | |
| R2=0.8622 | R2=0.9069 | |
|
ALB observed
vs. COOP site observed
|
||
| Tmax | Tmin | |
| COOP site | R2 | R2 |
| Cairo | 0.9507 | 0.8284 |
| Gloversville | 0.9320 | 0.9037 |
| East Jewett | 0.8928 | 0.8289 |
| ALB NGM MOS forecast vs. COOP site observed | ||
| Tmax | Tmin | |
| COOP site | R2 | R2 |
| Cairo | 0.8401 | 0.7960 |
| Gloversville | 0.8035 | 0.8511 |
| East Jewett | 0.8241 | 0.8266 |
Summary of some of the initial results from Fig. 1.
R2 values for the linear regression of ALB NGM MOS vs. COOP sites turned out to be less than ALB observed vs. ALB NGM MOS, as expected. It was hypothesized that the ALB observed vs. ALB NGM MOS regression would yield the highest R2 values since the ALB NGM MOS is the temperature guidance for Albany, and not for the COOP sites. However, the ALB NGM MOS did a good job forecasting Tmax for Cairo and Tmin for Gloversville, generating values of 0.8401 and 0.8511 respectively, for R2.
In general, for the linear regressions of ALB observed vs. COOP sites, there was a better correlation of Tmax than Tmin, which also was expected due to the greater variability in minimum temperatures. ALB observed Tmax was best correlated with Cairo Tmax, yielding an R2 value of 0.9507. Albany and Cairo are at similar elevations with Albany having an elevation of 92 meters, while Cairo's elevation is 149 meters.
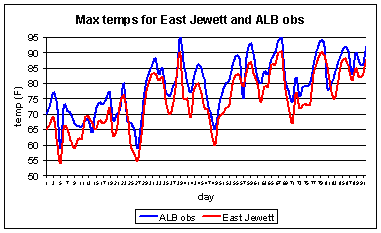
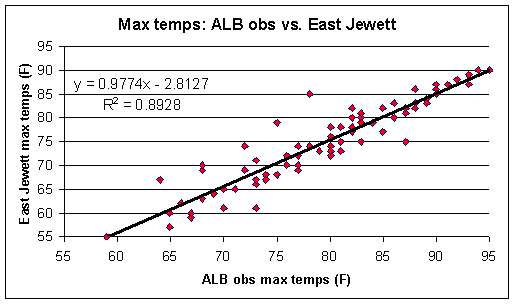
We next show example figures of a temperature graph, and linear regression equation/plot, respectively, for East Jewett versus Albany. Even though East Jewett is located in the Catskill Mountains at an elevation of 607 meters, the R2 value was 0.8928 for Tmax. In Fig. 2, it can be seen that the maximum temperatures for Albany and East Jewett are increasing at generally the same rate (exhibited by the slope of 0.9774 of the best fit straight line through the Tmax data points in Fig. 3), but are separated by a bias due to elevation differences. It is hypothesized that the temperature differences will eventually be accounted for when stratifying the data with the inclusion of stratification by elevation, using lapse rates.

Figure 2. Albany observed Tmax and East Jewett's Tmax for the
three-month test period with days shown on the x-axis and
temperature in degrees Fahrenheit on the y-axis.

Figure 3. Linear regression equation and the R2 value, as well
as the
temperature data points in degrees Fahrenheit.
SECTION 2: RELATED ACCOMPLISHMENTS
2.1 UA
Joe Villani gave an oral presentation entitled "COOP Station Forecast and
Verification Studies" at the Northeast Regional Operational Workshop on
8 November 2000 in Albany, New York.
2.2 NWS
At this point, the project is still in it's early stages, and preliminary results
are just being analyzed. Future plans include possible presentations of the
results by NWS forecasters at other WFO science meetings, as well as the future
development of a local temperature guidance algorithm at the WFO Albany.
SECTION 3: SUMMARY OF BENEFITS
3.1 UA
Work on this project has exposed us to some of the intricacies of local operational
temperature forecasting, specifically the sensitivity to terrain-influenced
local wind regimes and elevation effects. As the result of his research, Joe
Villani has learned a great deal about operational forecasting procedures. Given
that Joe wants to work at an operational job upon graduation, his new knowledge
should serve him well.
3.2 NWS
This project provides great potential for forecasting improvement. So far, results
are in only for the warm season months, which we can hopefully use operationally,
to some degree, this year.
SECTION 4.1: PRESENTATIONS AND PUBLICATIONS
The work being undertaken is the basis of Joe Villani's Master's thesis. Joe Villani gave an oral presentation on his results at the Northeast Regional Operational Workshop on 8 November 2000 in Albany, New York. The title of his presentation was: "COOP Station Forecast and Verification Studies". Co-authors include: Lance F. Bosart, Daniel Keyser, Michael J. Cempa, Thomas A. Wasula, and Stephen R. Pertgen.
SECTION 5: SUMMARY OF PROBLEMS ENCOUNTERED
5.1 UA
Aside from some minor delays in obtaining the needed temperature data from different
sources, no significant problems were encountered.
5.2 NWS
There have been no real problems from on the NWS side.