ABSTRACT
The frequency of the "wintry mix" of precipitation-freezing rain and sleet-is considerable in the Mid-Atlantic.
The proper forecast of type and duration of winter precipitation is one of the most difficult challenges in operational
meteorology in North America, with extensive public safety and economic ramifications.
One purpose of this project was to develop a methodology for improving these forecasts. In so doing, we created
the Discriminant Analysis Mixed Precipitation (DAMP 2.0) Model. This model is easy for the forecaster to use and
understand and provides probability guidance in situations that are difficult to resolve. The DAMP model has proven
its value in a number of operational forecast situations and has been incorporated into WFO Wakefield's forecasts.
In addition to forecast model development, a number of uniquely valuable data sets have been generated as a part
of this project. This work has also fostered a great deal of cooperation between the Virginia State Climatology
Office and WFO's throughout Virginia.
1. PROJECT PARTICIPANTS, OBJECTIVES AND ACCOMPLISHMENTS
1.1 Project Participants
National Weather Service Forecast Office, Wakefield, Virginia
Hugh D. Cobb, III, Science/Operations Officer
Michael P. Rusnak - Journeyman Forecaster
University of Virginia, State Climatology Office, Charlottesville, Virginia
Patrick J. Michaels, Virginia State Climatologist
Philip J. Stenger - Research Coordinator
Paul C. Knappenberger - Research Assistant/Programmer
James D. Hux - Graduate Research Assistant
Matt Matthias - Intern/High School Student
1.2 Project Objectives
The objective of this COMET funded research between the National Weather Service Forecast Office Wakefield (NWS),
Virginia and the University of Virginia (UVA) was to improve Mid-Atlantic winter mixed precipitation forecasts.
Essentially there were two relevant questions:
1) When will a mixed precipitation event start over Virginia?
2) How long will each class of precipitation last?
1.3 Division of Responsibilities
In addressing the question of when mixed precipitation will begin, the NWS concentrated on the role coastal frontogenesis
plays in the initiation and character of the precipitation in cold air damming events. While, UVA directed it
attention toward the statistical quantification of the relationship between surface and upper-air variables and
the type of precipitation occurring in the mixed precipitation events. The results of this analysis led to the
development of a forecast model by UVA. The NWS tested the performance of the model during the winters of 1997-1998
and 1998-1999.
The NWS portion of the study, examining the duration of each precipitation type, utilized historical rawinsonde
data to determine the strength of overrunning by calculating the magnitude of the 850mb and 700mb southerly wind
vectors. UVA's involvement in regards to question two is to determine the statistical relationship between the
duration of precipitation type and the surface area encompassed by the cold-dome.
Additionally, contributions from both the NWS and UVA were required prior to examining the research questions.
In this capacity, the NWS provided access to invaluable data that was unavailable to UVA. While, UVA was responsible
for database development.
1.4 Description of Research/Development Accomplishments:
1.4.1 Database Construction
Addressing the objectives of this study required the development of four distinct and original databases-a mixed-precipitation
event database, a meteorological variable-precipitation type database, a cold-dome area database (the surface area
in the Mid-Atlantic encompassed by the 1024mb, 1028mb, and 1032mb isobars), and a historical, multivariable, high
temporal and spatial resolution database formatted for GEMPAK Analysis and Rendering Program (GARP). These databases
are important accomplishments because of their use in this project and the ability to extend them to other research
beyond the scope of this project.
Mixed-precipitation event database (12/96-01/97):
The mixed-precipitation event database is developed for use in the analyses of the relationships between coastal
frontogenesis and precipitation type and cold dome area and precipitation type. There have been several previous
studies that have investigated the occurrence of such events over the southeastern and mid-Atlantic portions of
the United States. Although others (Gay and Davis (1993), Keeter et Cline (1991)) have developed frozen precipitation
event databases, none of these data sets were appropriate for this research due to considerations of spatial extent
and in the definition of events.
Therefore, the University of Virginia researchers developed a comprehensive and well-defined database of these
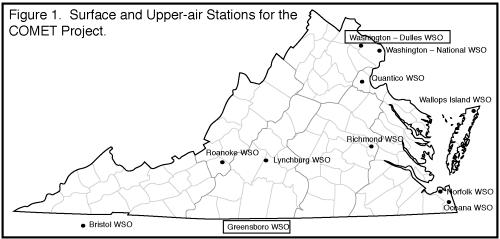
events in Virginia. Mixed precipitation events were selected and event duration calculated for all the first-order
stations in Virginia (Figure 1). Note that the boxed stations in the figure make upper-air observations. Further,
this database was better for this research than data sets from previous studies because the order of precipitation
types occurrences are also known.
The original data were collected from the digital NCDC Surface Airways Observations (Earthinfo, 1996) and manually
examined for mixed precipitation events, based on the following criteria:
1) The duration of precipitation was greater than or equal to 8 hours,
2) There was at least one change in precipitation type in which each type is at least 3 hours in duration, and
3) There were no periods longer than six hours without precipitation within an event.
The number of events identified ranged from 48 for Quantico to 142 for Bristol/Tri-Cities (Table 1). Identified
events were extracted from the original data and an event data set was created which to be used in subsequent research.
Table 1. Station locations, data coverage, and number of cases for the mixed precipitation event database.
| Location |
Period of Record |
Number of Events |
| Bristol/Tri-Cities, TN |
1960-1991 |
141 |
| Lynchburg, VA |
1960-1991 |
57 |
| Norfolk, VA |
1960-1991 |
63 |
| Oceana, VA |
1960-1987 |
55 |
| Quantico, VA |
1960-1987 |
48 |
| Richmond, VA |
1960-1991 |
69 |
| Roanoke, VA |
1960-1991 |
77 |
| Wallops Island, VA |
1966-1991 |
Too few events |
| Washington-Dulles, VA |
1962-1991 |
86 |
| Washington-National, VA |
1960-1991 |
78 |
Meteorological variables-precipitation type database
(03/98-04/98):
To investigate the meteorological conditions necessary to support the various winter precipitation types, data
from two distinct data sets are merged. The first includes hourly observations of precipitation type and surface
temperature from Greensboro, NC (1948-present) and Washington Dulles, VA (1962-present). All hours reporting precipitation
from the months November through March are extracted for each station. The second data set is the record of twice-a-day
upper-air observations for Greensboro and Washington Dulles.
These data sets were then combined in such a way to insure that the most accurate upper-air observation was available
for each precipitation occurrence at each station. In order to do this precipitation occurring within two hours
of an upper-air observation time is used for analysis. Although this eliminates a large amount of data, the number
of hourly observations including precipitation is sufficiently large that many hundreds of observations for each
station remain. Through this method a data set is constructed for each station containing the observed precipitation
type, surface temperature, and the upper-air observations of height and temperature (at 50mb increments between
1000mb and 500mb) from the nearest radiosonde station.
Coastal frontogenesis database (06/97-02/99):
Examining the relationship between precipitation type and coastal frontogenesis requires the use of a mixed-precipitation
event database of high temporal and spatial resolution surface maps. The search for surface maps to compliment
the event database (described above) led the NWS to 3-hourly North American Surface Charts. These maps only existed
as paper copies and were of poor quality, which made analysis difficult.
As a result, the NWS approached UVA with the idea of combining surface station, CMAN, and buoy data from several
digital sources (Earthinfo Surface Airways Observations 1995, Solar and Meteorological Surface Observation Network
1993, and CMAN and Buoy Reports and Summarized Elements 1996) into a format that could be used to create surface
maps for the Mid-Atlantic region. This merged data is then reformatted for automated coastal front analysis in
GARP.
The data set contains hourly observations of temperature, dew point temperature, sea-level pressure, present weather,
wind speed, wind direction, and sky cover. The hourly observations were intended to begin 48-hours prior to and
continue throughout all 235 mixed-precipitation events (1949-1991). However, due to inadequate density of the
buoy and C-man data over the near shore and coastal waters of Virginia and North Carolina in the surface plots
prior to 1984, it was decided to only use the surface plots constructed after 1984. These surface plots constructed
after 1984 contain 26 land-based stations concentrated east of the Appalachian Mountains and 14 C-MAN or buoy stations.
Cold dome database (06/97-08/98):
In an attempt to determine the statistical relationship between duration of precipitation type and a volumetric
estimate of the cold dome on a site-specific basis, our event database (Mixed Precipitation Database mentioned
above) was analyzed in concert with the historical 3-hr NCEP surface weather maps acquired from WFO Wakefield.
The University of Virginia created a digital area database from the 3-hr NCEP surface weather maps. The region
in which the areas were calculated extends from 30° to 40° N and from 75° to 85° W. The areas
within the 1024, 1028, and 1032 mb isobars within this latitude/longitude box were calculated by planimetry.
When deciding on methods for calculating and digitizing the cold dome areas, we considered two options: 1) Polar
planimetry and 2) using some GIS application. In the end, as we mentioned above, polar planimetry was chosen because
of its simplicity and time requirements.
The polar planimeter is a simple instrument used for accurate measurement of plane areas in any form. To measure
an area it is only necessary to run the tracer point around the periphery of the figure. However, as is the case
with all scientific instruments, the accuracy of the planimeter observations depends on several factors: 1) instrument
precision, 2) measurement conditions, 3) figure size, and 4) human error.
Since the measurements of cold dome area was made on a very large number of maps-approximately 1500-extensive tests
were initially performed to insure measurement accuracy. The first test involved a repeated measurement of a standard
unit area by the primary map technician. The mean of ten measurements was 0.997 with a standard deviation of 0.003.
These results indicated a very accurate measurement technique. The second test involved selecting a subset of
100 maps to be measured twice by the primary map technician. The two sets of measurements were then compared for
consistency. Figure 2 shows these results. The slope of the best fit least squares
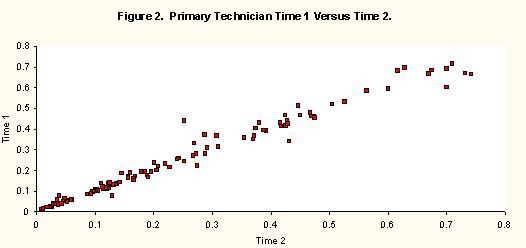
regression line was .994, which indicated practically no bias, and the percent variance explained was 98.8 percent
indicating very little variation about the regression line. This indicated the measurements were very internally
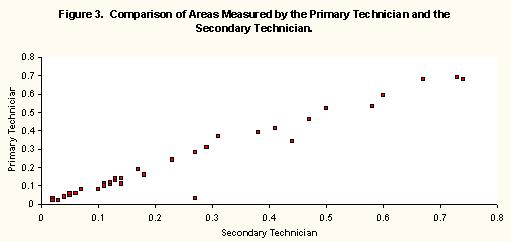
consistent. The third test was aimed at assessing the replication of the measurements by the primary map technician.
This test involved a subset of 30 maps that were re-measured by a second person. The two sets of measurements
were compared and the results presented in Figure 3. Here, the best fit least squares regression line had a slope
of 0.976, and the amount of variation explained was 95 percent. This indicates that there was very little measurement
bias between the measurers, implying the analysis was both accurate and repeatable.
1.4.2 Coastal frontogenesis and the initiation of mixed precipitation
In an attempt to answer questions 1 and 2 posed in section 1.2 of this final report
When will a mixed precipitation event start over Virginia?
How long will each class of precipitation last?
Principal investigators from WFO Wakefield performed three hourly analyses of surface maps containing surface
observations, C-MAN and Buoy reports for 10 mixed precipitation events occurring at Richmond, VA (RIC) and Roanoke,
VA (ROA) between January 1984 and January 1991 (Table 1).
Date of Event
Table 1. Event database for mixed precipitation events occurring in Richmond, VA and Roanoke, VA
January 18-19, 1984
March 21-23, 1985
January 18-19, 1987
February 16-17, 1987
February 27 - March 1, 1987
December 8-9, 1988
February 13-14, 1989
December 8-9, 1989
December 27-28, 1990
January 8-9, 1991
Richmond and Roanoke were selected as representative first order stations in the Virginia Piedmont for each mixed
precipitation event. Richmond is situated along the Fall Line, which is along the eastern edge of the Piedmont.
Roanoke is situated in an area that represents a transition from the Piedmont to the foothills of the Appalachians.
Thus the occurrence of mixed precipitation at both Richmond and Roanoke constituted a mixed precipitation event
for the Virginia Piedmont.
The surface analyses were performed to determine the location of the coastal front at three hourly intervals during
each of the mixed precipitation events. Previous coastal front research concluded that these features enhance precipitation
rates (Doyle and Warner (1992)), occasionally separate precipitation by type (Doyle and Warner (1992)) and are
often the focus for severe weather (Businger et al (1991)). Hourly surface analyses were performed to determine
the location of the coastal front during times of critical precipitation type changeover at Richmond and Roanoke.
A distinct coastal front as defined by Doyle and Warner (1990) was analyzed in 7 out of the 10 events in the event
database. Those events where the coastal front propagated inland resulted in a pronounced precipitation type changeover
from frozen (snow or sleet) to liquid precipitation. A coastal front was considered to have propagated inland if
it passed to the west of Cape Hatteras, N.C. in the hourly surface analyses.
If the coastal front did not propagate inland (remained offshore and did not pass to the west of Cape Hatteras,
N.C.) or had propagated inland and was in the process of retreating eastward to the coast there was no precipitation
type changeover or a precipitation type changeover from liquid or freezing precipitation to frozen precipitation
types (snow to sleet). Thus we were able to answer question 1, when will a mixed precipitation event start over
Virginia? The results of the surface analyses were inconclusive in determining how long each type of precipitation
would last. Thus we were unable to answer question 2 posed.
In another attempt to answer question 1, Principal investigators from WFO Wakefield constructed time series plots
of the direction and magnitude of the low level jet and winds at the 850 and 700 millibar levels from four rawinsonde
sites in Virginia and North Carolina. These sites included Greensboro, N.C. (GSO), Cape Hatteras, N.C. (HAT), Dulles
Airport, VA (IAD) and Wallops Island, VA. (WAL). The time series plots were constructed for each of the 10 mixed
precipitation events occurring between January 1984 and January 1991. The presence of a low-level jet was determined
by using the maximum wind in the significant level data from the surface to 850 millibars. In some cases the low-level
jet was not present and only the winds at the 850 and 700 millibar levels were used.
These time series were constructed to determine a correlation between the change in the direction and magnitude
of the low level jet and winds at the 850 and 700 millibar levels to precipitation type changeover in the Virginia
Piedmont. A distinct precipitation type changeover from frozen precipitation types (snow and sleet) to freezing
or liquid precipitation types occurred in all 10 cases. In all cases the low level jet and winds at the 850 and
700 millibar levels veered to a southerly direction (between 100 and 260 degrees in azimuth) and increased in magnitude.
In the two cases where the low level jet and winds at the 850 and 700 millibar levels veered to the east (between
70 and 100 degrees in azimuth) precipitation type changeover in the Virginia Piedmont was complete from snow to
rain.
1.4.3 Meteorological conditions that influence precipitation type-development of an
operational model
Over the course of this cooperative project, UVA has made great strides in
understanding the relationships between surface and upper-air variables and the precipitation type occurring in
the mixed precipitation events. In applying the knowledge gained, we have progressed from low resolution, two-dimensional
nomograms, following the work of Keeter and Cline (1991), to high resolution, multivariable models.
Nomograms and CART (12/96-06/97):
The analyses in this section used a data set that preceded the one mentioned above (Section 1.4.1 - Meteorological
Variable-Precipitation Type Database). This data set was similar to the final data set used for model development.
The exception was that the upper-air heights and temperatures (that were merged with precipitation type) were only
extracted for 1000mb, 850mb, and 700mb, and for the nomograms the upper-air data from Dulles and Greensboro were
merged with precipitation type from each first order station that was closest (see Figure 1 for the first order
stations).
The first analysis performed was to use classification and regression trees (CART) to best group the precipitation
into types. This technique built a decision tree that was traversed through a series of yes or no answers to questions
that were posed in the form of equations combining all the available input variables. The result of each equation
directed an input case down one side of the node or the other until a final classification was made. The result
was a near optimal classification of the input cases. The disadvantage of this technique was that oftentimes very
complex equations were created that, while mathematically useful, did not necessarily have a physical basis.
The second analysis involved constructing nomograms using the techniques similar to Keeter and Cline (1991). In
this analysis, a series of two-dimensional scatter-plots were produced in which precipitation type is related to
a pair of upper-air parameters. The utility of each pairing in the separation of individual precipitation types
could be assessed by the inspection of the nomograms.
The results using CART were mixed. If all the available variables were used as input variables (heights, temperatures,
and all partial thickness combinations), the classification was largely very accurate. However, the resulting
tree structure was quite complex and often resulted in classification trees with more than 30 nodes. At this level,
the physical interpretation of each node becomes impossible, and the solution becomes more of a "black box."
This type of solution was unacceptable in that the forecaster must rely on a tool without knowledge of its operations,
in effect, distancing the forecaster from the actual forecast. Secondly, such large classification trees tend
to be over-fit and, although they work well on the input data, their performance drops off as new data (data on
which the solution was not built) are used as input to the system.
In order to create a more useful solution, the number of input variables was decreased. This resulted in more
simple classification trees, although the classification scheme became less accurate overall. The solutions were
able to accurately separate most rain events from snow, but lost most of their ability to separate out sleet and
freezing rain events from the population of other precipitation types.
Although the use of CART techniques produced no easily useable results in terms of a forecast aide, the results
did indicate that a total separation of frozen precipitation types given the variables selected for analysis was
likely impossible. The results also showed that the best variables for discrimination were the 1000 to 850mb thickness,
and the 850mb temperature, followed by the 850 to 700mb thickness, the 1000 to 500mb thickness, and the temperature
at 700mb.
Figure 4 Winter Precipitation Nomogram for Dulles Airport:
The results in constructing nomograms seemed to be more useful in that each nomogram was easily interpreted by
the forecaster and was constructed using physically meaningful parameters. In order to find the best pairing of
upper-air measurements, the distribution of precipitation types within the values of each parameter were assessed
individually, with an eye towards the ones identified by CART as having the most discriminatory power. Then, the
pairings of the individual variables with the greatest separation between precipitation types were further examined.
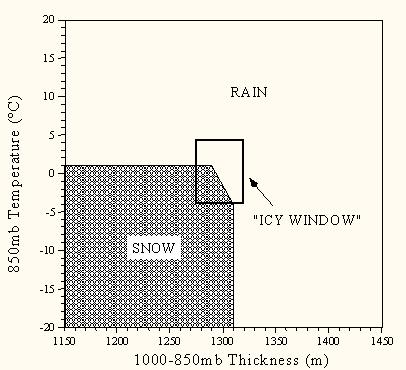
The pairing which was found to show the most separation between precipitation types was the 1000mb to 850mb thickness
and the temperature at 850mb. In most cases, this combination of variables was very good at discriminating between
rain and snow, and greatly reduced the conditions under which such discrimination was necessary (see Figure 4 for
nomogram for Dulles), but it could not adequately separate sleet and freezing rain conditions from those of rain
or snow.
From these results, we constructed nomograms for four of the nine Virginia stations and distributed them to the
WFO at Wakefield for preliminary testing during the winter of 1996-1997. Unfortunately, that winter did not cooperate
fully in that over the forecast area very little frozen precipitation occurred. Therefore, enough data could not
be gathered in order to make any quantitative assessment of the forecasting tool.
Although, the construction of two-dimensional nomograms was straightforward and provided some quantitative information
that a forecaster could use to discriminate between the types of wintertime precipitation, they were limited by
the fact that they were only two-dimensional and contained a region where any type of precipitation could occur.
This was dubbed the "icy window." Further within this "icy window" there was no further guidance
for the forecaster, and our efforts to incorporate more than two dimensions, via CART, proved unsatisfactory.
Multivariable Discriminant Analysis and Partial Thickness-Precipitation Type Relationships (06/97-03/98):
Subsequently, we incorporated another multi-dimensional discrimination and classification scheme into the examination
of the relationship between precipitation type and surface/upper-air parameters. This scheme is commonly referred
to as discriminant analysis and has two major goals: 1) Description of group separation and 2) Prediction/allocation.
In order to quantify group separation, linear functions of the variables are used to elucidate group differences
by identifying the relative contribution of each variable in-group separation. In the next step, linear or quadratic
functions are used to classify individual observations into one of the groups.
Discriminant analysis was performed on the two stations (Washington Dulles Airport and Greensboro, NC) in our region,
which have sounding data to accompany the surface observations. The groups chosen for discrimination were rain,
snow, and freezing rain mix. These groups were chosen because pure sleet was rarely observed at either location
and for the most part proves non-disruptive; whereas freezing rain (alone or in combination) is very disruptive
in our region. The variables chosen for analysis were:
1000-850 mb thickness
850-700 mb thickness
700-500 mb thickness
Surface temperature
850 mb temperature
700 mb temperature.
As was noted in the two dimension nomograms, there is an "icy window" (Figure 4) where any precipitation
type may occur and little guidance available to the forecaster. This concept was carried over into the discriminant
analysis. Here, instead of a two-dimensional "icy window", a multidimensional volume-which we will informally
call an "icy cube"- was defined in which all types of precipitation may occur (Figure 5).
The "icy cube" was created by dividing the temperature and thickness data into two tiers. The first
tier (inside the "icy cube") included all observations that fall with 2 univariate standard deviations
of the mean for each of the partial thicknesses and temperatures. We used this approach because, as we noted from
the bivariate nomograms, it within these ranges of temperatures and thicknesses that the separation between precipitation
type was minimal and very little guidance was afforded. The second tier, made of up observations outside of the
"icy cube," consisted of observations outside of 2 univariate standard deviations. The observations
outside of this volume were predominated by rain and snow with very few observations of a freezing mix and the
separation between rain and snow was maximized.
This two-tiered approach to the problem proved to be very valuable. For each of the stations we ran discriminant
analysis on the data inside and outside of the "icy cube." So, as a result, we had two separate functions
that described the relationships between the variables and precipitation type inside and outside of the "icy
cube" for each station. Tests of this method using cross-validation for both stations showed that rain, snow,
and freezing mix were correctly predicted in excess of 95, 80, and 51 percent of the time, respectively. As a
second run, a test data set (1992-1995) for both stations was used in the model. Again, rain and snow were predicted
correctly greater than 95 and 80 percent of the time on average, respectively, while, the correct forecast of freezing
mix dropped to less than 50 percent.
The results from this analysis were used to create the first iteration (referred to in previous reports as the
SLEEZE-SLeet and frEEZing rain-machine or DAMP 1.0) multidimensional forecast models for Washington-Dulles and
Greensboro. These models were introduced to WFO Wakefield and tested during the 1997-1998 winter season. The downside
was that the models were still predominantly "black boxes," because of their quadratic nature. However,
these models were an advancement over previous work because they incorporated more than two dimensions-they informed
the forecaster if the parameters place them inside or outside of the icy region, and they provided probabilities
of precipitation type. These probabilities were of direct aid to the forecaster and provided a valuable piece
of additional information in the development of a winter precipitation forecast.
The DAMP 1.0 testing procedure, implemented at the forecast office in Wakefield for the winter of 1997-1998, required
that the forecaster record the input values as well as the precipitation type probabilities for each winter precipitation
event during the season. These values were used in the verification procedures. Unfortunately, the winter of
1997-1998 was unusually warm and afforded very few opportunities to test the model in an operational mode. The
results of the model test from the winter's five events are presented in Table 5.
Although, the winter only produced five mixed precipitation events to test, a weakness in DAMP 1.0 was exposed
by one of the cases. On January 19, 1998, the model predicted a snow event when rain actually occurred. An in-depth
analysis of the dynamics of this event indicated that a very, low-level warm air intrusion acted to melt the falling
snow and produced only rain at the surface. This resulted because the bottom 1500m of the atmosphere was represented
by only two variables (1000-850mb thickness and 850mb temperature).
Development of the Discriminant Analysis Mixed Precipitation (DAMP 2.0) Model (03/98-04/99):
From our previous model attempts, UVA learned many valuable lessons in the areas of model building and what meteorological
conditions promote the various kinds of winter precipitation types. While, nomograms were easy for the forecaster
to use and understand there were areas (combinations of variables) where all precipitation types can occur and
no guidance was available. These were commonly known as "Icy Windows." Likewise, the multidimensional
models were not problem-free. Regardless of the method (CART or discriminant analysis), the models tended to become
cumbersome "black boxes" that, while mathematically useful, do not necessarily have a physical basis.
By limiting the vertical resolution, many important precipitation type
determinants are missed. So, while developing our multivariate model UVA had three objectives:
1) Develop a model that is easy for the forecaster to use and understand.
2) Do not limit the vertical resolution.
3) Provide probability guidance to the forecaster in situations that are difficult to resolve.
Subsequently, UVA shifted to using the highest resolution possible from the historical radiosonde data-50mb increments
(Section 1.4.1 - Meteorological Variable-Precipitation Type Database). The original attempt with this finer resolution
data set was to calculate a partial thickness for each 50mb interval. These partial thickness values along with
surface temperature and upper-air temperatures (for all levels between 1000-500mb) were subjected to discriminant
analysis to determine which level(s) best discriminate between precipitation types. While this produced an adequate
model, it was difficult to determine what decisions it was making. We felt that we had exploited the partial thickness
method for all of its inherent information, especially with regard to our model objectives.
Figure 6. The four vertical temperature profiles associated with winter precipitation types.
UVA then incorporated a new approach into the third iteration of analyses and model development. The Discriminant
Analysis Mixed-Precipitation Version 2.0 (DAMP 2.0) model, as the name implies, still incorporated high vertical
resolution and multivariate discriminant analysis to forecast precipitation type. However, the partial thickness
approach was abandoned for a method that combined some basic meteorology, a more complete use of all the data,
and disciminant analysis's ability to resolve multidimensional relationships. We asked the question, "What
do the various vertical temperature profiles look like during these winter precipitation events?" Examination
of the data showed that there are four basic temperature profiles during the winter for both Greensboro and Dulles
(Figure 6). Each of these profiles produced characteristic types of precipitation. Note that sleet was not included
in these models because it occurred infrequently compared to other types of precipitation and was considered non-disruptive
in an operational sense compared to heavy snows and freezing rain.
Site-specific models (decision trees) were then built with this new information by splitting the data into the
four different vertical temperature profiles and performing statistical analyses at each node (Figures 7). A complete
discussion of the model for Washington Dulles Airport follows and Greensboro is mentioned where the models are
different. The trees show the forecaster the decisions that they and DAMP 2.0 make during execution of the model.
The first sort (No Crossings - Yes or No) on the data (Figure 8) divides the data into two groups-cases where
the entire temperature profile is either all positive or all negative and cases where the temperature profile crosses
0°C once or more. At the next node (One Crossover - Yes or No), the data is subdivided again into situations
where the column temperatures start above freezing cross 0°C and continue to decrease with height, and situations
where temperatures cross 0°C multiple times. The final node (Two Crossovers - Yes or No) separates the remaining
cases into 1) those that are below freezing near the surface, move above freezing above the surface and then fall
below freezing higher in the atmosphere, and 2) those that have three or more freezing levels.
No Crossings (Figure 8):
At this point, the only other variable required to forecast precipitation type is a temperature from somewhere
in the column to determine whether the entire column is above or below freezing. We chose temperature at the 850mb
level (800mb for Greensboro) because the temperatures at these heights are the most important for discrimination
in the one crossing and two crossing parts of the models. For the two crossing case (which will be discussed in
detail later), 850mb tends to fall between the two freezing levels and, as a result, the temperature gives a good
indication of the amount of warming.
As it turns out for the no-crossings case, there are no winter precipitation cases where the entire column (1000-500mb)
temperature is above freezing. On the other hand, when the entire column is below freezing, two precipitation
types occur-snow (370 times) and freezing rain (10 times). Although, there are 10 occurrences (2.6% of the within
group and 1.5% of the overall cases) of freezing rain in this scenario, DAMP 2.0 makes a forecast of snow which
climatologically speaking occurs 97.4% of the time in this case. Our explanations for the 10 cases of freezing
rain are sub-scale processes occurring below our level of resolution, super-cooled water making it to the surface,
or observational errors.
One Crossing (Figure 9):
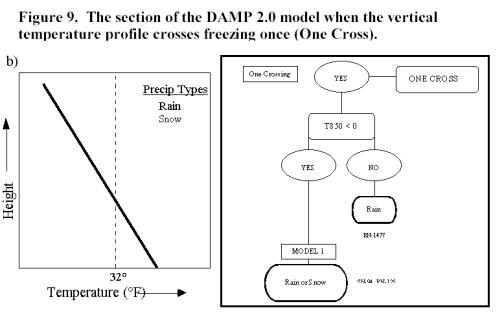
Again, in this part of DAMP 2.0 the first decision to be made is whether the 850mb temperature is above or below
0°C. If the 850mb temperature is above freezing the forecast is rain (1477 times) because no other precipitation
type occurs in this group. This is nearly 60% of all the rain cases. However, if the 850mb temperature is below
freezing then rain (125 times) or snow (95 times) can result and DAMP 2.0 uses discriminant analysis to resolve
precipitation type. The variables that the model requires to run the analysis are 1) the 850mb temperature and
2) the height of the freezing level. Precipitation type forecasts within this section of the model (situations
that would be very difficult for forecasters to resolve) are 81.8% correct (Table 3).
Table 3. Discriminant Analysis Mixed-Precipitation Model 1 (Rain vs. Snow/One Crossing - 850mb Temperature Below
Freezing) Classification Results for Washington Dulles Airport (Percentage Correct - 81.8% Percentage Incorrect
- 18.2%).
| Observed Precipitation |
Forecast as Snow |
Forecast as Rain |
Observed Total |
| Snow Counts |
76 |
18 |
94 |
| Percent Forecast Snow |
78.3 |
14.8 |
|
| Rain Counts |
21 |
104 |
125 |
| Percent Forecast Rain |
21.6 |
85.2 |
|
| Total Forecast |
97 |
122 |
219 |
Two Crossings (Figure 10):
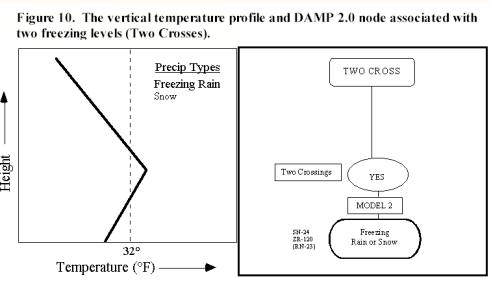
The two crossover node of DAMP 2.0 isolates nearly
all (120 observations or 91%) of the occurrences of freezing rain during the period of record for Washington Dulles.
Along with the freezing rain, there are 24 observations of snow that account for about 5% of all the snow hours.
Discriminant analysis is also incorporated here to discriminate between precipitation types. The classification
results for this node of the DAMP 2.0 model are presented in Table 4. Freezing rain is forecast correctly 85.8%
of the time. Although, snowfall forecasts within this part of DAMP 2.0 are only correct 50% of the time, very
little snow occurs under these conditions and the increased ability to predict freezing rain far outweighs the
ramifications of missing snow. 5
19
24
50
14.1
5
115
120
50
85.8
10
134
144
Table 4. Discriminant Analysis Mixed-Precipitation Model 2 (Two Crossings) Classification Results for Washington
Dulles Airport (Percentage Correct - 67.9% Percentage Incorrect - 32.1%).
Observed Precipitation
Forecast as Snow
Forecast as Freezing Rain
Observed Total
Snow Counts
Percent Forecast Snow
Freezing Rain Counts
Percent Forecast Freezing Rain
Total Forecast
Three Crossings (Figure 11):
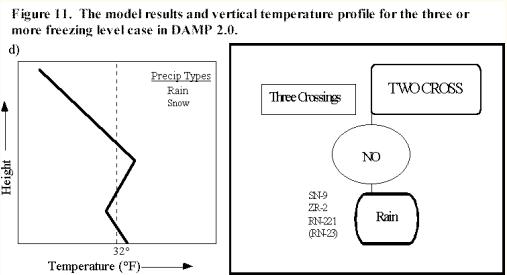
When there are three or more points in the vertical temperature profile that cross 0°C the probability of getting
rain is approximately 96% (244 observations out of 255). Because there are 9 observations of snow and 2 observations
of freezing rain out of 255 total observations in this scenario, we decided to always forecast rain.
As has been shown DAMP 2.0 is no longer a partial thickness/temperature based model. Instead, DAMP 2.0 uses freezing
level height(s), vertical temperature profiles, and basic meteorology to resolve the forecasts of snow, rain and
freezing rain. The revised model is, definitely, an improvement for the forecaster because it meets our criteria
for model development, and performed better than (Table 5) and is no longer a "black box" like previous
models. It makes better use of the available data and keeps the best features of DAMP 1.0-the ability to isolate
and provide probability guidance in scenarios that are difficult to resolve. It is a multidimensional, physically
based model that is easy for the forecaster to use and the forecaster can follow the model-decision-making process
in virtually every case. Also, the model does an outstanding job of predicting precipitation type in mixed-precipitation
events.
Although DAMP 2.0 was developed for the locations (Greensboro and Dulles) where upper air data and surface data
were both present, the models retained a high degree of accuracy when its results were applied at other locations
in similar climatological regions. In Virginia, Dulles DAMP 2.0 should be and has been successfully applied to
events occurring in Piedmont and Tidewater locations. While, Greensboro DAMP 2.0 was suitable for higher elevation
stations in the Blue Ridge Mountains and foothills.
Table 5. Classification Performance Comparison Between DAMP 1.0 (1997-1998) and DAMP 2.0 (1998-1999) for Washington
Dulles, VA.
|
1997-1998 |
||||
| Observed Precipitation |
Rain |
Freezing Rain |
Snow |
Total |
| Forecast as Rain |
2400 |
14 |
56 |
2470 |
| Forecast as Freezing Rain |
4 |
68 |
15 |
87 |
| Forecast as Snow |
73 |
38 |
503 |
614 |
| Total |
2477 |
120 |
574 |
3171 |
|
1998-1999 |
||||
| Observed Precipitation |
Rain |
Freezing Rain |
Snow |
Total |
| Forecast as Rain |
1825 |
2 |
27 |
1854 |
| Forecast as Freezing Rain |
0 |
115 |
19 |
134 |
| Forecast as Snow |
21 |
15 |
451 |
487 |
| Total |
1846 |
132 |
497 |
2475 |
DAMP 2.0 and a formal testing procedure were delivered to WFO Wakefield in early-December. DAMP predicted the December
23-24, 1998 ice storm in Virginia with 95% confidence. NWS forecasters incorporated the model output into their
forecast discussions, alerting state and local governments to the threat of freezing rain. This storm left over
380,000 Virginia Power customers without electricity, many went without power for more than a week-one of the largest
power outages in Virginia history. If this model continues to perform in this manner, we can hopefully be more
prepared for events like this in the future. In addition, to this event there were seven others in which the model
was used operationally. The model predicted the precipitation type correctly in seven of the eight events. In
every case the correct prediction was made 48hrs. before the event occurred. In the event that was missed the
Eta Model's predicted soundings did not verify with the observed sounding. For this event, the DAMP model predicted
rain while the actual precipitation was freezing rain. The observed 850mb temperature was 11.5 degrees colder
than Eta predictions and the model under-predicted the height of the freezing levels by 100m to 400m.
DAMP 2.0 is made up of a set of discriminant equations, which, given a set of input parameters, output the probability
of each of three precipitation types (snow, rain, freezing rain). The models took the form of a computer program
that prompts the user to enter the values of the required input variables, which he/she has previously retrieved
from the forecast grids. When these are entered, precipitation type probabilities are then output.
References:
Businger, S., W. H. Bauman, III and G. F. Watson, 1991. The Development of the Piedmont Front and Associated Outbreak
of Severe Weather on March 13, 1986. Mon. Wea. Rev., 119, 2224-2250.
Doyle, J.D. and T.T. Warner, 1990. Mesoscale Coastal Processes during GALE IOP 2. Mon. Wea Rev., 118, 283-307.
Doyle, J.D. and T.T. Warner, 1992. The impact of the Sea Surface Temperature Resolution on Mesoscale Coastal Processes.
Mon. Wea. Rev., 121, 313-334.
Doyle, J.D. and T.T. Warner, 1992. A Three-dimensional numerical investigation of a Carolina coastal low level
Jet during GALE IOP 2. Mon. Wea. Rev., 121, 1030-1047.
Hartfield, G.I., 1998. Cold Air Damming: An Introduction. Eastern Region Training and Evaluation Module No. 4.,
December 1998.
Keeter, K.K. And J.W. Cline, 1991. The objective use of observed forecast thickness values to predict precipitation
type in North Carolina. Weather and Forecasting. 6, 456-469.
Stauffer, D.R. and T.T. Warner, 1987. A Numerical Study of Appalachian Cold Air Damming and Coastal Frontogenesis.
Mon. Wea. Rev., 115, 799-821.
U.S. Department of Commerce and U.S. Department of Energy, 1993. Solar and Meteorological Surface Observation
Network 1961-1990, Version 1.0.
Earthinfo, 1995. NCDC Surface Airways Observations.
NCDC and NDBC, 1996. C-MAN and Buoy Reports and Summarized Elements, Version 1.0.
1.4.4 Cold-dome area and precipitation duration
UVA could not find a statistically significant relationship between cold-dome area and precipitation duration.
As has been discussed in previous sections, coastal front cyclogenesis, vertical temperature structure, the location
of vertical freezing levels, and the strength of the southerly wind vector at 850mb and 700mb are all more strongly
related to precipitation duration than the surface area within the 1024mb, 1028mb, or 1032mb isobars.
1.4.5 Albemarle County High School Internship Program
Matt Matthius, a student at Albemarle County High School interested in Atmospheric Sciences interned in our office
during the spring 1998 semester. While, in our office Matt became interested in the COMET project and was invited
to assist us by digitizing the cold-dome areas from the NCEP surface maps.
2. SUMMARY OF UNIVERSITY/NWS EXCHANGES
Since the inception of this project, exchanges of information between WSFO Wakefield and the Virginia State Climatology
Office have grown enormously in frequency and variety. Cooperation on this project has opened the door to discussions
on a variety of weather and climate issues. The Virginia State Climatology Office and WSFO Wakefield are both responsible
for providing insight when extreme events affect the Commonwealth. Recent examples include advising the Virginia
Drought Monitoring Task Force, hurricane preparedness, and winter weather forecasting.
Optimism over the results of this project has facilitated discussion between Wakefield and UVA for future cooperative
research projects-including ways to build on this current project and other regional forecasting and weather related
problems that require research.
Ed Mahoney of the Buffalo National Weather Service Office has expressed interest in the inclusion of algorithms
from DAMP into BUFKIT. BUFKIT is a forecast profile visualization and analysis tool kit developed by the staff
at NWS Buffalo. As of January 1999 it was in use at more than 60 NWS, DOD, University, and Environment Canada
locations. BUFFKIT interfaces with the model output data directly. If DAMP 2.0 were incorporated into this package
the forecaster would no longer be required to enter the parameter manually.
WFO Wakefield has provided or assisted in the acquisition of data for a number of other research projects at the
University of Virginia.
As a result of this project, several students in the Environmental Sciences Department of UVA have served as volunteers
at the WFO Wakefield. The most recent volunteer was Karl Mertig.
Students in the Environmental Sciences Department of the University of Virginia toured the Wakefield office on
several occasions. These tours were conducted to promote increasing collaboration between WFO Wakefield and UVA
and have become an annual activity. Additionally, these visits introduce students interested forecasting to NWS
tools and procedures.
WFO Wakefield has also been very good at familiarizing UVA participants to new technology implemented in their
office, including GARP, AWIPS, and Digital Atmosphere. Additionally, Dustin Hux, one of the graduate investigators
employed by UVA for this project visited the WFO Wakefield to discuss using the WATADS software package to view
level II radar imagery for a class project.
The Virginia State Climatology Office maintains an active archive of historical weather information for the Commonwealth
of Virginia and in many cases surrounding states. The WSFO Wakefield has contributed climatological reports, notes
on special weather events, etc. to the State Climatology Office to enhance its archives.
3. PRESENTATIONS AND PUBLICATIONS
Cobb, H.D., 1996: Complexities of Precipitation Type Forecasting in the Mid-Atlantic. WFO Wakefield Winter Weather
Workshop, Wakefield, VA, December 19, 1996.
Michaels, P.J., Knappenberger, P.C., Hux, J.D., 1997: Introduction to a Precipitation Type Forecasting Scheme to
Isolate the "Icy-Window." WFO Wakefield Winter Weather Workshop, Wakefield, VA, December 4, 1997.
Cobb, H.D., 1997: Relationship of the Distribution of Precipitation Type across Virginia to Patterns of Cyclogenesis.
WFO Wakefield Winter Weather Workshop, Wakefield, VA, December 4, 1997.
Knappenberger, P.C, 1998: Icing the Forecast. Virginia Climate Advisory, 22(3) Fall.
Knappenberger, P.C., Hux, J.D., 1998: Quantitative Analyses of Precipitation Changeover in Mid-Atlantic Mixed Precipitation
Winter Storms-The DAMP Model. WFO Wakefield Winter Weather Workshop, Wakefield, VA, December 15, 1998.
Hux, J.D., 1999: Quantitative Analyses of Precipitation Changeover in Mid-Atlantic Mixed Precipitation Winter Storms
and the DAMP Model. 14th Annual Environmental Sciences Research Forum, University of Virginia, Charlottesville,
VA, January 18, 1999.
Michaels, P.J., Knappenberger, P.C, Stenger, P.J., Cobb, H.D., Rusnak, M.P., Hux, J.D.
Development of a Discriminant Analysis of Mixed Precipitation (DAMP) Model for Winter Precipitation Forecasting
in the Mid-Atlantic. Draft to be submitted to Weather and Forecasting Fall 1999.
Cobb, H.D., Rusnak, M.P. The role of coastal frontogenesis in precipitation type changeover in the Virginia Piedmont.
Teletraining session under development. Fall 1999.
4. SUMMARY OF BENEFITS AND PROBLEMS ENCOUNTERED
4.1 University's perspective
The University has benefited immensely from this collaborative effort with the WFO Wakefield. Throughout the course
of this project we have visited Wakefield twice a year. This has allowed us to become increasingly familiar with
and develop positive relationships with all the staff at WFO Wakefield. This, in turn, has enhanced the coordination
of operations and the exchange of information between WFO Wakefield and the University of Virginia. Collaterally,
our interaction and exchange of information with the Blacksburg and Sterling WFO's has also increased. As a result,
the citizens of Virginia have access to improved weather and climate services.
This will hopefully be the first in a very long line of cooperative projects with WFO Wakefield. As such, both
organizations have already discussed future projects involving winter weather forecasting and other avenues of
research (Also mentioned Section 2).
The Virginia State Climatology Office is called upon by many individuals, organizations, and the media for winter
weather guidance. Incorporation of this research for the past three years has given us the ability to better prepare
the public for disruptive winter weather. This has already contributed to improved weather guidance in a number
of cases, including the inauguration of Virginia's governor.
Results from this cooperative study were presented in weather forecasting classes taught by Patrick Michaels during
the spring of 1997 and 1999 at the University of Virginia. The students implemented these findings in their graded
forecasts. Also, as mentioned in Section 2, these students have visited Wakefield and been introduced to NWS tools
and procedures as a result of this research. Several of these students are presently on-air meteorologists in
the region. This ability to incorporate cutting edge research and tools into the classroom allows for more prepared
and knowledgeable people entering the weather and climate community.
Findings from this cooperative project were presented in a synoptic climatology class at the University of Virginia
taught by Dustin Hux as an example of the utility of discriminant analysis. This course was taught in the spring
1998 semester.
4.2 NWS perspective
WFO Wakefield has reaped numerous benefits from this collaborative effort with UVA. This project has fostered a
positive working relationship with the faculty in the Environmental Sciences Department at the University of Virginia.
This relationship has allowed our office access to invaluable climate data in the construction of a climate database
for various locations within our County Warning Area as our office transitions to Stage 2 forecast responsibilities.
Results from the COMET Project have been incorporated into the forecast operations and training program at WFO
Wakefield. Forecasters have gained a new understanding of the complexities of mixed precipitation forecasting in
the Virginia Piedmont. In addition forecasters have a conceptual model of coastal fronts and their role in the
initiation of mixed precipitation events in the Virginia Piedmont.
The DAMP models have also provided the forecasters with a new forecast tool in winter precipitation forecasting.
The inclusion of the output of this model in forecast discussions and the success of the DAMP 2.0 model forecasts
during the Christmas Eve Ice Storm of 1998 has served to increase the level of science incorporated into winter
weather forecasting operations.
The following is a portion of an Area Forecast Discussion (AFD) from the afternoon of December 22, 1998 which described
in detail the output of the DAMP 2.0 model and its incorporation into the forecast process for the severe ice storm
of December 23-24, 1999.
AREA FORECAST DISCUSSION
NATIONAL WEATHER SERVICE WAKEFIELD VA
306 PM EST TUE DEC 22 1998
.....SO...WRT SN...NOT IN FAVOR OF IT FOR CWA (XCPT FAR NW CTYS WED EVE). PREFERRED TEMP OF -10 DEG C AT PCPN GENERATION
LYR FOUND BTWN 4.5 AND 5 KM WHICH LEAVES A SGFNT WRM CLD DEPTH FOR ANY SN FLAKES TO SURVIVE TO SFC. RUNNING LCL
PROGRAM (DAMP - DISCRIMINANT ANALYSIS OF MIXED PRECIPITATION) GAVE NRLY 95% CHC OF PROLONGED PD OF FREEZING PCPN
GENLY ALG AND NW OF A TAP TO AVC LINE. LEANING HEAVILY TWD CLIMO FOR THESE TYPE OF EVENTS...THINKING MOSTLY RA
XTRM SE VA INTO NE N.C....THEN FZRA TO SLEET TRANSITION TO NW ACRS CWA (WED NGT/THU MORNING). UPR 40S/NR 50 DEG
F WTR TEMPS SHUD HELP PREVENT SERIOUS PROBLEMS ALG CST.
Results from this COMET Project have provided an abundance of training material for the forecast staff at WFO Wakefield.
Findings from this cooperative project were presented during our annual Winter Weather Workshops held in 1996,
1997 and 1998.
The challenge of forecasting the onset of a mixed precipitation event and the scope of the COMET project was introduced
at the Winter Weather Workshop held in December 1996.
The spectrum of Cold Air Damming (Hartfield, 1998) and its implications in precipitation type forecasting in the
Virginia Piedmont was presented at the Winter Weather Workshop held in December 1997. In addition the DAMP 1.0
model for precipitation type forecasting was introduced. As described earlier in this final report this model required
forecast partial thicknesses at the 1000-850 millibar, 850-700 millibar and 700-500 millibar levels and the forecast
temperature at the surface, 850 millibars and 700 millibars. Preliminary findings on the performance of this model
were also presented.
Several winter weather forecasting techniques were presented at the Winter Weather Workshop held in December 1998.
A case study of embedded snow streaks in rain that occurred in January 1998 was presented. This case was noteworthy
in that the DAMP 1.0 model forecast a greater than 90% probability of snow in the Richmond area based on forecast
partial thicknesses in the lower levels of the atmosphere and surface, 850 and 700 millibar temperatures. The actual
precipitation type was rain. The model did not account for the relatively deep warm layer that existed below 850
millibars. In addition precipitation rates and the corresponding vertical motions were too weak to tap cold air
which existed above 850 millibars to sufficiently cool the column of air to support snow.
The DAMP 2.0 model for precipitation type forecasting was introduced at this Winter Weather Workshop. As described
earlier this model required the forecast heights of the freezing level (up to three levels) in meters and the temperature
at 850 millibars as input.