SECTION 1: PROJECT OBJECTIVES AND ACCOMPLISHMENTS
At present, river forecasting efforts by the Southeast River Forecast Center do not include tidal fluctuations for the station at Conway, South Carolina (SC). Unfortunately, recent tidal data is not readily available for Conway, SC. Tide tables that have been established may be out of date due to changes that have occurred over time to the coast and ocean floor. Those tide tables that are up-to-date and available are not transferable to this location.
The objective of this project was to develop a two-dimensional tidal model for the coastal region surrounding Conway, South Carolina (SC). The tidal model was used to simulate six real-time stage hydrographs at the downstream end of the Waccamaw River. The resulting stage hydrograph will serve as a downstream boundary condition for the Flood Wave model (FLDWAV) that is used by the National Weather Service River Forecast System (NWSRFS). Results from this project are expected to enhance forecasting by the Southeast River Forecast Center.
The Civil and Environmental Engineering Department at the University of Central Florida accomplished three major tasks during this study. Details on all aspects of the research can be found in the publications that are listed in Section 3 of this report.
1) A two-dimensional, finite element domain was developed for the coastal region surrounding Conway, SC.
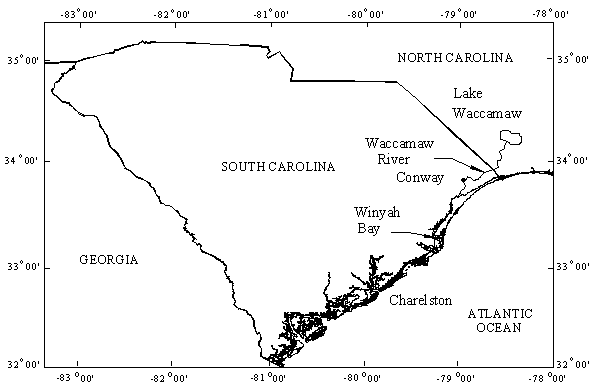
The project area is located in the northern region of the South Atlantic Bight along the southeast coast of the United States. The Waccamaw River drains the coastal areas of southern North Carolina and northern South Carolina. The river leaves Lake Waccamaw in North Carolina and flows southward through Conway, South Carolina. From there, the river flows southward to the confluence with the Great Pee Dee and Black Rivers, through Winyah Bay, and into the Atlantic Ocean as shown in Figure 1.
An unstructured mesh was produced for the entire coast of South Carolina (Figure 1) by employing a localized truncation error approach to mesh generation. The final unstructured grid (Figure 2) uses 10,013 nodes to define discrete locations and depths.
2) Simulations were performed to calibrate and verify the model based on historical data.
Fully nonlinear, hydrodynamic calculations were performed with ADCIRC-2DDI [Westerink, et al.], a two-dimensional depth integrated circulation code. The simulation employed a constant bottom friction coefficient of 0.003, a generalized wave continuity equation weighting parameter of 0.009, which controls the contribution from primitive continuity, and an eddy viscosity of 0.0. A no-flow boundary condition was enforced at all land boundaries and open ocean boundaries were forced with the , , , , , , , and tidal constituents. 90 days of real time were simulated with the unstructured grid (Figure 2), beginning at 12:00 AM (GMT) on January 1, 1998. A time step of 10 s was used to meet Courant condition requirements and ensure dynamic steady-state results. In addition, a hyperbolic ramping function was imposed during the first five days.
Figure 3 shows the historical tide gage data at Charleston for the period of January 1, 1998 through March 31, 1998. Figure 4 presents the modeled results for the same time period. Figure 5 displays the historical and modeled tide elevations for a 15-day period at the end of March 1998. When comparing the modeled results to the historical data, it is important to realize that the historical data results from all actual astronomical and meteorological tidal forcings present at that time while the modeled results include only the astronomical tide forcings. Figures 3-5 indicate that the modeled results estimate the tidal elevations reasonably well at Charleston, SC.
3) Simulations were conducted to generate six separate real-time stage hydrographs, which will be used by the NWS Southeast River Forecast Center for future forecasts.
Fully nonlinear, hydrodynamic calculations were performed with ADCIRC-2DDI to generate six separate hydrographs. Table 1 and Figure 6 display the locations. The simulation employed a constant bottom friction coefficient of 0.003, a generalized wave continuity equation weighting parameter of 0.009 and an eddy viscosity of 0.0. A no-flow boundary condition was enforced at all land boundaries and open ocean boundaries were forced with the , , , , , , , and tidal constituents. 397 days of real time were simulated with the unstructured grid (Figure 2), beginning at 12:00 AM (GMT) on December 1, 1999. A time step of 10 s was used. In addition, a hyperbolic ramping function was imposed during the first five days.
Figure 7 presents a one-day sample of the tide-stage hydrographs for the Waccamaw River, including the Charleston, SC location. It should be noted that the location of a downstream boundary for any NWSRFS river forecasting effort should directly correspond to the location of the tide-stage hydrograph that is used as the downstream location. Failure to do so will result in errors in amplitude and phase, which could significantly effect river stage forecast accuracy.
It is recommended that future work should focus on five major tasks. 1) Meteorological forcings should be included in order to better predict the historical record. 2) It may be prudent to expand the domain further up the Waccamaw River such that the intra-coastal waterway (see Figure 1) can be included. The tidal effect from this reach may have a direct influence on the Waccamaw River stage. Simulations could then include the comparison of tidal hydrographs at different locations along the coastal boundary, as well as the combined effect of two inlets, e.g., the case of Conway, having the Winyah Bay and the intra-coastal waterway. 3) Storm surge simulations should be conducted with the present tidal model. It may be beneficial to compare ADCIRC model output to SLOSH model output. 4) A simulation of the effects of a flood wave routed from Longs, SC coincident with the arrival of a storm surge would prove useful to the Southeast River Forecast Center. This would allow for the evaluation of the impacts of the double effect on Conway, SC. 5) The domain should be expanded to include the entire East Coast of the United States and that of the Gulf of Mexico. The resulting model would be capable of providing tide-stages for all affected rivers in one simulation. This larger model could benefit five of the thirteen NWS River Forecast Centers.
SECTION 2: SUMMARY OF UNIVERSITY/ NWS EXCHANGES
Feb. 13, 1998: Dr. Scott C. Hagen presented, "Advances in Finite Element Modeling of Coastal Ocean Hydrodynamics" at the National Weather Service's Southeast River Forecast Center Office.
July 22, 1999: Reggina Garza visited the University of Central Florida to review project progress and present to hydrology students.
Aug. 23, 1999: Dr. Scott C. Hagen presented project results at the National Weather Service's Southeast River Forecast Center Office.
Oct. 24-27, 1999: Dr. Scott C. Hagen attended the NWS River Forecast System International User Workshop in Silver Spring, Maryland.
SECTION 3: PRESENTATIONS AND PUBLICATIONS
Bennett, R.J., 1999: Finite element grid development for the Waccamaw River: a reproducible approach, Masters Thesis, Department of Civil and Environmental Engineering, University of Central Florida, Orlando, Florida.
Hagen, S.C., O. Horstmann, and R.J. Bennett, 1999: A reproducible approach to unstructured mesh generation for shallow water models, Proceedings of the 8th International Meshing Roundtable, Sandia National Laboratories, Albuquerque, NM, 345-354.
Hagen, S.C., O. Horstmann, and R.J. Bennett, 1999: A reproducible approach to unstructured mesh generation for shallow water models, Presentation at the 8th International Meshing Roundtable, South Lake Tahoe, October 11-13.
Hagen, S.C. and R.J. Bennett, 1999: A tide-stage hydrograph for the Waccamaw River, Proceedings of the 6th Estuarine and Coastal Modeling Conference, In review.
Hagen, S.C. and R.J. Bennett, 1999: A tide-stage hydrograph for the Waccamaw River, Presentation at the 6th Estuarine and Coastal Modeling Conference, New Orleans, Nov. 3-5.
Westerink, J.J., C.A. Blain, R.A. Luettich Jr., and N. W. Scheffner, "ADCIRC: an advanced three-dimensional circulation model for shelves, coasts and estuaries, Report 2: user's manual for ADCIRC-2DDI," Technical Report DRP-92-6, Department of the Army (1994).
SECTION 4: SUMMARY OF BENEFITS AND PROBLEMS ENCOUNTERED
University Perspective
The main benefit to the University from this project has been the establishment and expansion of a positive relationship between UCF and NWS. The UCF investigator and the NWS are discussing new directions for collaborative efforts, including efforts involving other river forecast centers as noted above.
Dr. Hagen has incorporated aspects of operational forecasting to students in his Hydrology class (CWR 4101) at the University of Central Florida. In addition, Ms. Reggina Garza has made presentations to undergraduate and graduate students at UCF during the summer semester of 1999. As a result, this research will continue to benefit undergraduate and graduate students at UCF.
NWS Perspective
The increased interest in research at the Southeast River Forecast Center office has been focused on the use of the Flood Wave model, FLDWAV, which has resulted in additional training. Because this office includes a large portion of the Atlantic Coastal area, as well as the Gulf of Mexico, having a model capable of producing the tidal hydrographs at different locations is definitely a benefit.
During the development of this project, a major hurricane (Floyd) affected the area included in this study. At the time, routing in the Waccamaw River was a big issue. Traditional routing can't be used at a location that is influenced not only by tides, but is also a very flat area. The future setting to compute the routing for the Waccamaw River between Longs and Conway will use the hydrographs resulting from this cooperative study with the University of Central Florida. This should improve forecasting operations at this location and also allow personnel from the Southeast River Forecast Center to get more familiar with this state-of-the-art method. Efforts are underway to continue the collaboration with the University of Central Florida.
Because of the reasons stated above, there has been an increased interest in recruiting university students to perform and help in the setting of the routing method. Recently the Southeast River Forecast Center was invited by Clark Atlanta University to make a presentation on Partnership efforts in research and education. The topic presented by this office was the need of including Dynamic Routing in some of our basins. Thus, Clark Atlanta University will provide one student to work on the implementation of Flood Wave at Conway.
Figure 1 The Coast of South Carolina
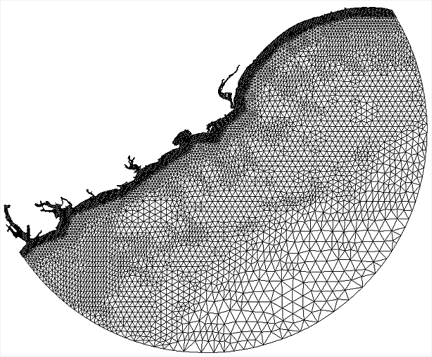
Figure 2. Unstructured mesh for the South Carolina domain.
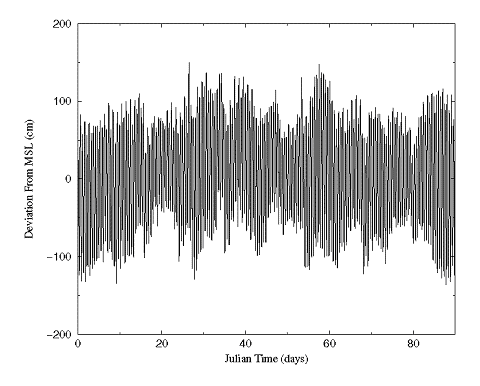
Figure 3. Charleston historical tide gage data, 1/1/98 - 3/31/98
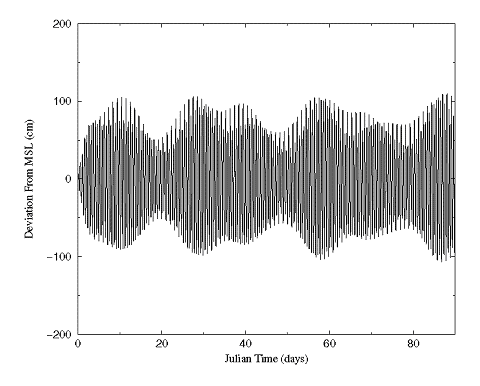
Figure 4. Charleston modeled results, 1/1/98 - 3/31/98
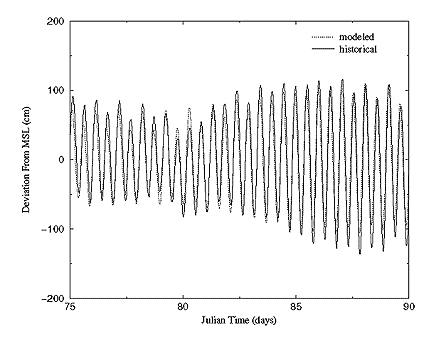
Figure 5. Charleston historical data and modeled results, 3/16/98 - 3/31/98
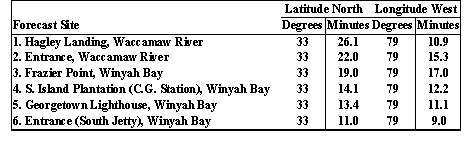
Table 1. Tide Stage Forecast Sites, Listed in Order of Priority
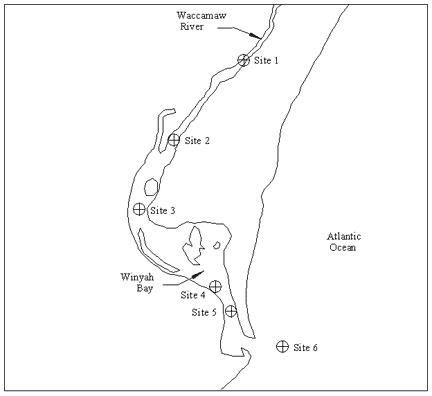
Figure 6. Forecast Site Locations
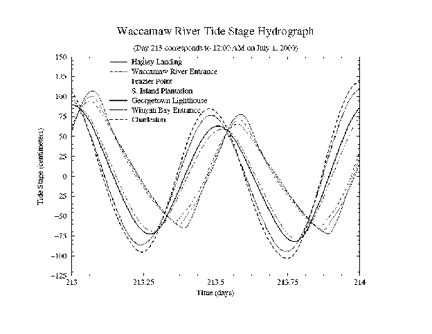
Figure 7. Tide-stage hydrographs for the Waccamaw River region.