What is MetEd?
The MetEd website, COMET’s signature offering, is a free collection of hundreds of training resources intended for the geoscience community. We deliver over 240,000 hours of online education each year in disciplines such as aviation weather, climate, convective weather, emergency management, hydrology, numerical modeling, satellite meteorology and winter weather, among many others.
A variety of MetEd lessons are translated in multiple languages. COMET partners with many international stakeholders and is sponsored by global agencies such as, National Oceanic and Atmospheric Administration (NOAA), European Organisation for the Exploitation of Meteorological Satellites (EUMETSAT), Meteorological Service of Canada (MSC), National Science Foundation (NSF), World Meteorological Organization (WMO) and many more.
Sign up for any lessons on our site free of charge. Registration is quick and easy!
Don't forget to check out and subscribe to our YouTube channel for additional education and training content.
Latest MetEd Publications
-
Microwave Analysis of Tropical Cyclones, 2nd Edition
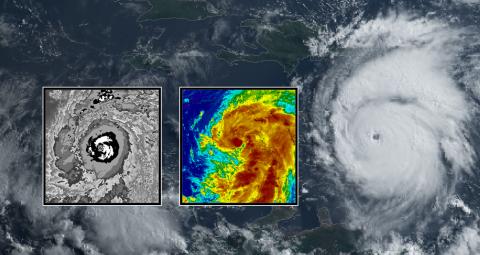
This lesson introduces forecasters to the use of microwave image products for observing and analyzing tropical cyclones. Microwave observations from low Earth orbiting satellites are crucial to today’s operational forecasters, and particularly for those with maritime and coastal forecasting responsibilities where in situ observations are sparse. This lesson includes information on analyzing storm structure and techniques for improved storm positioning using the 36 to 37 and 85 to 91 GHz channel regions from several satellite sensors. Updated examples include events observed by sensors on board S-NPP, JPSS, GCOM-W and GPM satellites.
-
Air Quality Forecasting Case Study: British Columbia Smoke Event
This lesson places learners at a forecast desk in Vancouver, British Columbia as they forecast the potential for a reduced air quality event. Forecast emphasis is placed on synoptic, mesoscale, and microscale features and the role features at these scales have on air quality. The lesson uses two different smoke forecast models, the FireWork Smoke model and HRRR-Smoke, to help learners determine the magnitude and longevity in a reduced air quality event.
-
GOES-R/JPSS Case Exercise: Applications for Heavy Rainfall & Flash Flooding
This 45-minute lesson highlights GOES-R and JPSS satellite products that can provide useful information to forecasters during heavy rainfall scenarios. In this lesson, the learner takes on the role of a forecaster working a shift during a potential heavy rainfall event across Pennsylvania and New Jersey. As a forecaster, the learner analyzes and interprets various satellite products to better understand the environmental factors conducive for heavy rainfall and flash flooding.
-
Working With Water Level Data: Establishing Accurate Water Levels
Coastal water levels rise and fall for many reasons, including the rhythm of the tides and other factors. People measure water levels for many purposes, including safe navigation, marsh restoration, coastal mapping, and monitoring sea level change. Management of the coastal zone can be drastically improved by precisely and accurately knowing how water levels relate to land elevations. As a result, working in this area frequently requires measuring water levels and conducting a proper survey. This lesson provides guidance on the survey design choices to be made when measuring water levels, including siting, choosing instrumentation, observing water levels, and surveying a water level station. A major theme throughout the lesson is how to reduce uncertainty in water level measurements and the resulting tidal datums.
-
Tactical Fire Weather Forecasting
Wildland Firefighters rely on accurate weather forecasts to plan their operations. Weather forecasters in the NWS are frequently called upon to provide spot forecasts to firefighters, particularly before a fire reaches a size that warrants an Incident Meteorologist. Gridded forecasts available through the National Digital Forecast Database (NDFD) typically do not meet firefighter needs because they do not account for the finer details forced by terrain and microscale effects including slope winds and sheltering. In this introductory lesson, you will practice fine-tuning a grid forecast to account for these small-scale variations in wind forecasts.
-
NBM v4.0 Probability of Weather Type
The National Blend of Models version 4.0 (NBM v4.0) uses a modified Bourgouin technique to calculate a conditional probability of weather type (PoWT). This lesson explains conditional probability and the modified Bourgouin method, as well as the Freezing Rain Accumulation Model (FRAM) used in the NBM.
-
National Geodetic Survey - Webinar Series
NOAA’s National Geodetic Survey (NGS) provides the framework for all positioning activities in the nation. The foundational elements of latitude, longitude, elevation, and shoreline information impact a wide range of important activities. Our primary end-users are land-surveyors and engineers, but also include other physical scientists and geospatial professionals. Many of these professionals need training to maintain their certification, and to that end, these recorded webinars have been made available on topics of NGS’ geodesy and coastal mapping programs, products, and research. More specific topics include: GPS is quickly becoming accessible to everyone for navigation and other applications. NGS specifically supports “high-accuracy” GPS positioning, which often requires “survey-grade” GPS equipment. Remote sensing often refers to scanning the earth by satellite or aircraft. Quickly evolving technology related to aerial photography and lidar is making remote sensing a more efficient way to gather data over large geographic areas. Land surveying is the technique and science of determining the position of points and the distances and angles between them. It has been a core part of NGS’ mission since the 1800s and is still supported today through guidelines and tools. Geodesy is the science of accurately measuring and understanding three fundamental properties of the Earth: its geometric shape, its orientation in space, and its gravity field— as well as the changes of these properties with time. Users can view a webinar in its entirety to earn a certificate of attendance. Certificates earned are kept within the user’s account on MetEd.
-
National Water Model FIM Services
This training package on Flood Inundation Mapping (FIM) consists of four 4-6 minute video trainings and one 20-minute interactive lesson. The videos will focus on the reason that FIM is a necessity, and the two FIM services available with NWM: 1) the NWM FIM and (2) the Replace and Route (RnR) FIM. The interactive lesson will guide the learner through the process of recognizing what the various FIM options contain and how they are used. This lesson will cover the two FIM options with the NWM, as well as FIM available from the Advanced Hydrologic Forecast Service (AHPS).
-
Analyzing and Evaluating Risk
This lesson demonstrates the aspects of risk and risk assessment that need to be considered when implementing Impact-based Forecasting (IBF) in your forecast office. You play the role of a forecaster for the fictional country of Tiziki that is implementing IBF for the first time. You will be introduced to the different portions of risk matrices and how to assess each using impact tables and your knowledge of local effects. Your job will be to make two different forecasts using the risk matrix based on the same hazard that covers both forecast regions of interest. Learners should complete the "Impact-Based Forecasting: Identifying Hazards and Constructing Impacts Tables" lesson before attempting this lesson.
-
Using METplus Verification Software to Diagnose Model Biases
You’ve been busily working on model runs for the past grueling year. You think you see a trend in the data but are struggling to confirm your theory. The stress is building slowly and the deadlines are creeping closer. Mounds of unanalyzed data are piling up in your storage. To finish the “Results” section of your paper, you need to determine if the forecasts are improved and diagnose why. This lesson will help meteorologists understand how to use verification software to evaluate model output compared to a verification dataset. We'll use METplus to show you how to analyze single location forecasts as well as feature-relative forecasts. Let's dive in!